
Introduction
economic calendar tender offer Python analysis is a useful way to understand market conditions by combining economic event data with tender offer information. For beginners, this means we are not only looking at stock prices, but also checking important market events and corporate actions that may influence investor decisions.
In this tutorial, we will use Python in Google Colab to fetch data from an API, process economic calendar events, analyze tender offer activity, and generate simple market insights. Each cell is explained in simple language so even beginners can understand what the code does and why it matters.
LINK API
https://rapidapi.com/user/yasimpratama88
Cell 1 — Import Library
import requestsThis cell imports the requests library.
For beginners, requests is used to connect Python with an API. In this notebook, it helps us send requests to the Indonesia Stock Exchange API through RapidAPI.
Cell 2 — Setup API
API_KEY = "YOUR_RAPIDAPI_KEY_HERE"

headers = {
    "Content-Type": "application/json",
    "x-rapidapi-host": "indonesia-stock-exchange-idx.p.rapidapi.com",
    "x-rapidapi-key": API_KEY
}
This cell prepares the API connection.
The API_KEY is your private RapidAPI key. The headers variable tells the API that we are sending a JSON request and provides authentication.
Do not publish your real API key in an article. Use a placeholder like YOUR_RAPIDAPI_KEY_HERE.
Cell 3 — Ambil Economic Calendar
url_economic = "https://indonesia-stock-exchange-idx.p.rapidapi.com/api/calendar/economic"

response_econ = requests.get(url_economic, headers=headers)
data_econ = response_econ.json()

print("Economic API Status:", response_econ.status_code)

import json
print(json.dumps(data_econ, indent=2))
This cell fetches economic calendar data from the API.
The economic calendar may contain important market events such as inflation data, interest rate announcements, and other macroeconomic indicators.
The line below sends a request to the API:
response_econ = requests.get(url_economic, headers=headers)Then the response is converted into JSON format:
data_econ = response_econ.json()The status code helps us check whether the request worked. If the status code is 200, the request was successful.
Cell 4 — Get Tender Offer
url_tender = "https://indonesia-stock-exchange-idx.p.rapidapi.com/api/calendar/tender-offer"
response_tender = requests.get(url_tender, headers=headers)
data_tender = response_tender.json()

tender_events = data_tender.get("data", {}).get("data", {}).get("tender", [])

import json
print(json.dumps(data_econ, indent=2))
This cell fetches tender offer data from the API.
A tender offer is a corporate action where an investor or company offers to buy shares from existing shareholders, usually at a specific price.
The data is stored in:
data_tenderThen the main tender offer list is extracted using:
tender_events = data_tender.get("data", {}).get("data", {}).get("tender", [])This code safely accesses nested JSON data. If the data does not exist, it returns an empty list instead of causing an error.
Note: in your notebook, the final print line displays data_econ, not data_tender, so the article keeps it exactly the same as your file.
Cell 5 — Data Processing
# ambil data economic
economic_events = data_econ.get("data", {}).get("data", [])

# ambil data tender
tender_events = data_tender.get("data", {}).get("data", {}).get("tender", [])
This cell extracts the main economic and tender offer data.
The variable economic_events stores economic calendar events, while tender_events stores tender offer events.
This step is important because raw API responses are usually nested. Before analysis, we need to extract the specific data we want to use.
Cell 5 Continued — Basic Calculation
# jumlah event
econ_count = len(economic_events)
tender_count = len(tender_events)

# tender aktif
active_tender = [t for t in tender_events if t["corp_action_active"]]
active_count = len(active_tender)

# rata-rata harga tender
prices = [int(t["tender_price"]) for t in tender_events]
avg_price = sum(prices) / len(prices) if prices else 0
This cell calculates important metrics.
First, it counts how many economic events and tender offer events are available:
econ_count = len(economic_events)
tender_count = len(tender_events)
Then it filters active tender offers:
active_tender = [t for t in tender_events if t["corp_action_active"]]After that, it calculates the average tender price:
avg_price = sum(prices) / len(prices) if prices else 0This is useful because it gives a simple overview of corporate action activity and average tender pricing.
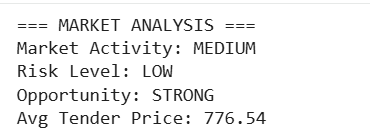
Cell 6 — Analysis Engine
print("=== MARKET ANALYSIS ===")

# 1. Market Activity
if econ_count > 5 and active_count > 3:
    activity = "HIGH"
elif econ_count > 2 or active_count > 1:
    activity = "MEDIUM"
else:
    activity = "LOW"

print("Market Activity:", activity)

# 2. Risk Level
if econ_count > 7:
    risk = "HIGH"
elif econ_count > 3:
    risk = "MEDIUM"
else:
    risk = "LOW"

print("Risk Level:", risk)

# 3. Opportunity Signal
if active_count > 2:
    opportunity = "STRONG"
elif active_count > 0:
    opportunity = "MODERATE"
else:
    opportunity = "WEAK"

print("Opportunity:", opportunity)

# 4. Average Tender Price
print("Avg Tender Price:", round(avg_price, 2))
This cell works as the analysis engine.
It creates four main outputs:
Market Activity
Measures whether the market is active based on economic events and active tender offers.Risk Level
Uses the number of economic events to estimate market risk.Opportunity Signal
Uses active tender offers to determine whether there may be market opportunities.Average Tender Price
Shows the average price from tender offer data.
For beginners, this cell converts raw numbers into easier labels such as HIGH, MEDIUM, LOW, STRONG, MODERATE, and WEAK.
Result:
Cell 7 — Smart Insight
print("\n=== SMART INSIGHT ===")

if activity == "HIGH" and opportunity == "STRONG":
    print("🔥 Market sangat aktif + banyak peluang (bullish momentum)")
elif risk == "HIGH":
    print("⚠️ Banyak event ekonomi → market bisa volatile")
elif opportunity == "STRONG":
    print("📈 Banyak tender → peluang saham tertentu naik")
else:
    print("📊 Market cenderung normal")
This final cell generates a simple conclusion from the previous analysis.
If market activity is high and opportunity is strong, the code prints a bullish momentum signal.
If risk is high, it warns that the market may become volatile.
If opportunity is strong, it highlights that tender offers may create opportunities in certain stocks.
Otherwise, the market is considered normal.
Result :

Conclusion
economic calendar tender offer Python analysis helps beginners understand how market events and corporate actions can be processed into simple insights. Instead of reading raw API data manually, this notebook turns economic calendar and tender offer information into market activity, risk level, opportunity signal, and smart insight.
This workflow can be developed further into a stock market dashboard, trading alert system, or financial decision-support tool. The key lesson is simple: data becomes more useful when it is processed into clear and understandable signals.