
Understanding market conditions often requires looking beyond stock prices alone. Investors frequently monitor economic events because economic announcements can influence market sentiment, sector performance, and investor behavior. At the same time, reviewing historical price movements through OHLCV data can help users understand how a stock has traded over a specific period.
Economic Calendar data provides visibility into important economic events such as inflation reports, interest rate decisions, employment figures, and other indicators that may affect financial markets. Meanwhile, OHLCV data provides information about a stock's daily Open, High, Low, Close, and Volume activity.
In this project, we build an IDX Economic Calendar and BBCA OHLCV Dashboard using Python and the Indonesia Stock Exchange API. The notebook retrieves Economic Calendar data and BBCA OHLCV data, processes the responses, and displays the information through a simple dashboard interface.
The notebook is divided into five main sections. The first section imports the required libraries, followed by API configuration, helper functions, data retrieval, and dashboard generation.
What This Project Builds
This project creates an IDX Economic Calendar and BBCA OHLCV Dashboard that combines:
Economic Calendar data
BBCA OHLCV Daily Data
Structured dataframe output
BBCA price summary metrics
Dashboard monitoring interface
By combining both datasets into a single workflow, users can review economic events together with BBCA daily price movement data from one dashboard.
CELL 1 — Import Libraries
import requests
import pandas as pd
import time
from IPython.display import display, Markdown

pd.set_option("display.max_columns", None)
pd.set_option("display.max_colwidth", 100)
pd.set_option("display.width", 1000)
Explanation
The project begins by importing the required libraries.
The requests library is used to communicate with the IDX API, while pandas is used to process and display structured data. The time library is used to create delays between API requests, and display together with Markdown is used to create a cleaner dashboard presentation inside Google Colab.
The notebook also configures pandas display settings to allow all available columns to be displayed more clearly and prevent excessive truncation when reviewing API responses.
CELL 2 — API Configuration
BASE_URL = "https://indonesia-stock-exchange-idx.p.rapidapi.com"

HEADERS = {
    "Content-Type": "application/json",
    "x-rapidapi-host": "indonesia-stock-exchange-idx.p.rapidapi.com",
    "x-rapidapi-key": "your_api_key"
}
Explanation
Cell 2 contains the API configuration used throughout the notebook.
The BASE_URL variable stores the IDX API endpoint, while HEADERS contains the request configuration required for communication with the API service.
These settings are reused whenever the notebook requests Economic Calendar data and BBCA OHLCV data.
CELL 3 — Helper Functions
def fetch_api(endpoint, retries=3, delay=5):
    url = BASE_URL + endpoint

    for attempt in range(retries):
        try:
            response = requests.get(url, headers=HEADERS, timeout=30)

            if response.status_code == 200:
                return response.json()

            elif response.status_code == 429:
                print(f"Rate limit terkena. Percobaan {attempt + 1}/{retries}. Menunggu {delay} detik...")
                time.sleep(delay)
                delay *= 2

            else:
                print(f"Error {response.status_code}: {response.text}")
                return None

        except Exception as e:
            print(f"Request error: {e}")
            time.sleep(delay)

    return None


def extract_list(data):
    if data is None:
        return []

    if isinstance(data, list):
        return data

    if isinstance(data, dict):
        possible_keys = [
            "data", "result", "results", "items", "list",
            "calendar", "economic", "chart", "ohlcv"
        ]

        for key in possible_keys:
            if key in data:
                value = data[key]

                if isinstance(value, list):
                    return value

                if isinstance(value, dict):
                    for sub_value in value.values():
                        if isinstance(sub_value, list):
                            return sub_value

        return [data]

    return []
Explanation
Cell 3 creates helper functions used throughout the project.
The fetch_api() function retrieves data from the IDX API. The function includes retry handling and rate-limit management so the notebook can continue attempting requests if temporary issues occur.
The extract_list() function is designed to extract list-based data from different API response structures. This allows the notebook to process Economic Calendar data and BBCA OHLCV data more consistently.
CELL 4 — Retrieve Data
display(Markdown("## 📥 Fetching Data from IDX API"))

economic_calendar_raw = fetch_api("/api/calendar/economic")

time.sleep(5)

ohlcv_raw = fetch_api("/api/chart/BBCA/daily?to=2026-02-18&limit=0&from=2026-02-10")

display(Markdown("✅ Data retrieval completed"))
Explanation
Cell 4 retrieves the required datasets from the IDX API.
The notebook begins by displaying a message indicating that data retrieval is in progress. It then requests Economic Calendar data using the Economic Calendar endpoint provided by the IDX API.
After waiting for five seconds, the notebook retrieves BBCA daily OHLCV data using the chart endpoint. The selected period ranges from 10 February 2026 to 18 February 2026.
Once both requests have been completed, the notebook displays a confirmation message indicating that the data retrieval process has finished successfully.
CELL 5 — Dashboard Output
display(Markdown("# 📊 IDX Economic Calendar and BBCA OHLCV Dashboard"))
display(Markdown("Dashboard sederhana untuk membaca agenda ekonomi dan data pergerakan harga harian BBCA."))

# ===============================
# Economic Calendar
# ===============================
display(Markdown("## 🗓️ Economic Calendar"))

economic_data = extract_list(economic_calendar_raw)

if len(economic_data) > 0:
    try:
        economic_df = pd.json_normalize(economic_data)

        display(Markdown(f"Jumlah agenda ekonomi yang berhasil ditampilkan: **{len(economic_df)} agenda**"))

        selected_economic_columns = [
            col for col in economic_df.columns
            if any(keyword in col.lower() for keyword in [
                "date", "time", "month", "item", "actual", "previous", "forecast"
            ])
        ]

        if selected_economic_columns:
            display(economic_df[selected_economic_columns].head(20))
        else:
            display(economic_df.head(20))

    except Exception as e:
        display(Markdown(f"❌ Gagal mengolah data Economic Calendar: {e}"))
else:
    display(Markdown("Tidak ada data Economic Calendar."))


# ===============================
# BBCA OHLCV
# ===============================
display(Markdown("## 📈 BBCA OHLCV Daily Data"))

ohlcv_data = extract_list(ohlcv_raw)

if len(ohlcv_data) > 0:
    try:
        ohlcv_df = pd.json_normalize(ohlcv_data)

        display(Markdown(f"Jumlah data OHLCV BBCA yang berhasil ditampilkan: **{len(ohlcv_df)} data**"))

        selected_ohlcv_columns = [
            col for col in ohlcv_df.columns
            if any(keyword in col.lower() for keyword in [
                "date", "time", "open", "high", "low", "close", "volume", "value"
            ])
        ]

        if selected_ohlcv_columns:
            display(ohlcv_df[selected_ohlcv_columns])
        else:
            display(ohlcv_df)

        numeric_columns = ["open", "high", "low", "close", "volume"]

        for col in numeric_columns:
            if col in ohlcv_df.columns:
                ohlcv_df[col] = pd.to_numeric(ohlcv_df[col], errors="coerce")

        if "close" in ohlcv_df.columns:
            latest_close = ohlcv_df["close"].dropna().iloc[-1]
            highest_price = ohlcv_df["high"].dropna().max() if "high" in ohlcv_df.columns else None
            lowest_price = ohlcv_df["low"].dropna().min() if "low" in ohlcv_df.columns else None

            summary_data = {
                "Metric": [
                    "Latest Close Price",
                    "Highest Price",
                    "Lowest Price"
                ],
                "Value": [
                    latest_close,
                    highest_price,
                    lowest_price
                ]
            }

            summary_df = pd.DataFrame(summary_data)

            display(Markdown("### Ringkasan BBCA"))
            display(summary_df)

    except Exception as e:
        display(Markdown(f"❌ Gagal mengolah data OHLCV BBCA: {e}"))
else:
    display(Markdown("Tidak ada data OHLCV BBCA."))

display(Markdown("✅ Dashboard berhasil dibuat."))
Explanation
Cell 5 builds the final IDX Economic Calendar and BBCA OHLCV Dashboard.
The dashboard begins by displaying a title and a short description explaining that the dashboard is designed to monitor Economic Calendar information together with BBCA daily price movement data.
The first section focuses on Economic Calendar data. The notebook extracts the data, converts the response into a dataframe, and displays the total number of economic agendas retrieved from the API. The notebook then filters columns related to date, time, month, event items, actual values, previous values, and forecasts before displaying the first twenty records.
The second section focuses on BBCA OHLCV Daily Data. The notebook extracts the OHLCV dataset, converts it into a dataframe, and displays the total number of records retrieved from the API. Relevant OHLCV columns such as date, open, high, low, close, volume, and value are then displayed.
The notebook also converts price-related columns into numeric values for further processing. Afterward, it calculates three summary metrics consisting of the latest closing price, the highest recorded price, and the lowest recorded price within the selected period.
These summary metrics are displayed through a separate dataframe called Ringkasan BBCA.
Finally, after both sections have been completed successfully, the dashboard displays a confirmation message indicating that the dashboard has been created successfully.
Result:
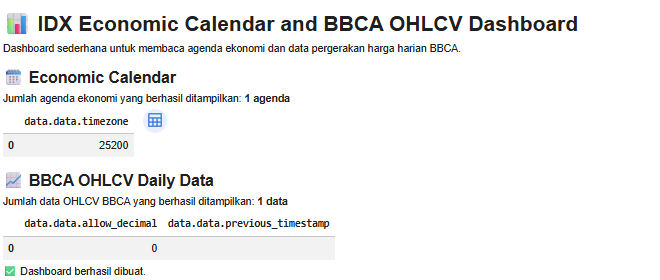
Dashboard Output
Economic Calendar
The dashboard displays Economic Calendar information returned by the IDX API.
If data is available, the notebook converts the response into a dataframe and displays important economic information related to dates, times, event items, actual values, previous values, and forecasts.
The first twenty records are displayed to make the output easier to review.
BBCA OHLCV Daily Data
The dashboard displays BBCA daily OHLCV information returned by the IDX API.
The notebook shows available OHLCV records and displays important trading information such as:
Open Price
High Price
Low Price
Close Price
Volume
Value
In addition, the dashboard generates a BBCA summary table containing:
Latest Close Price
Highest Price
Lowest Price
This summary provides a quick overview of BBCA price activity during the selected period.
Overall Workflow
Import required libraries.
Configure IDX API access.
Create helper functions for data retrieval and processing.
Retrieve Economic Calendar data.
Retrieve BBCA OHLCV data.
Process API responses.
Display Economic Calendar information.
Display BBCA OHLCV information.
Generate BBCA summary metrics.
Display the dashboard.
Why This Project Matters
Economic Calendar information and OHLCV data are important components of market monitoring.
Economic events can influence investor sentiment and market conditions, while OHLCV data helps users understand how a stock has traded during a specific period.
By combining both datasets into a single dashboard, users can access macroeconomic information and stock price activity through one workflow.
Conclusion
The IDX Economic Calendar and BBCA OHLCV Dashboard demonstrates how Python can be used to retrieve, process, and display Economic Calendar data together with BBCA OHLCV data from the Indonesia Stock Exchange API.
The notebook combines both datasets into a single dashboard, allowing users to monitor economic events and daily stock price movements through a structured interface.