
Introduction
dividend calendar IPO calendar data analysis Python API is a practical way to analyze corporate action data using Python. In the stock market, IPO data helps investors track companies that are newly listed, while dividend calendar data helps identify companies that distribute profits to shareholders.
In this tutorial, we will use Python in Google Colab to fetch IPO Calendar and Dividend Calendar data from an API. Then, we will process the API response into DataFrames, combine important fields, visualize the number of IPO and dividend records, and analyze the top dividend values.
This article is beginner-friendly. Every cell is explained clearly so readers can understand what the code does and why each step matters.
Cell 1 — Import Library
import requests
import pandas as pd
import matplotlib.pyplot as plt
import time
This cell imports the libraries used in the notebook.
requests is used to fetch data from the API. pandas is used to process the data into tables. matplotlib.pyplot is used to create charts. time is used to add delay before API requests.
Cell 2 — API Configuration
RAPIDAPI_KEY = "YOUR_RAPIDAPI_KEY_HERE"

headers = {
    "Content-Type": "application/json",
    "x-rapidapi-host": "indonesia-stock-exchange-idx.p.rapidapi.com",
    "x-rapidapi-key": RAPIDAPI_KEY
}
This cell prepares the API authentication.
The RAPIDAPI_KEY is used to access RapidAPI. The headers variable contains important request information, including content type, API host, and API key.
Never publish your real API key publicly.
Cell 3 — API URL
ipo_url = "https://indonesia-stock-exchange-idx.p.rapidapi.com/api/calendar/ipo"
dividend_url = "https://indonesia-stock-exchange-idx.p.rapidapi.com/api/calendar/dividend"
This cell defines two API endpoints.
ipo_url is used to fetch IPO Calendar data. dividend_url is used to fetch Dividend Calendar data.
Cell 4 — Function to Fetch API Data
def get_api_data(url):
    time.sleep(2)

    response = requests.get(url, headers=headers)

    if response.status_code == 200:
        return response.json()
    else:
        print("Gagal mengambil data:", response.status_code)
        print(response.text)
        return None
This cell creates a reusable function called get_api_data().
The time.sleep(2) line gives a 2-second delay before sending the request. This helps reduce the chance of hitting API rate limits.
If the response status code is 200, the function returns JSON data. If the request fails, it prints the error status and returns None.
Cell 5 — Fetch IPO and Dividend Data
ipo_data = get_api_data(ipo_url)
dividend_data = get_api_data(dividend_url)
This cell fetches data from both APIs.
ipo_data stores the IPO Calendar response. dividend_data stores the Dividend Calendar response.
Cell 6 — Process IPO Data
ipo_list = ipo_data["data"]["data"]["ipo"]

df_ipo = pd.DataFrame(ipo_list)
df_ipo["jenis_aksi"] = "IPO"

df_ipo.head()
This cell extracts IPO data from the JSON response.
The IPO list is taken from ipo_data["data"]["data"]["ipo"], then converted into a pandas DataFrame called df_ipo.
A new column called jenis_aksi is added with the value "IPO" to label the data source.
Cell 7 — Check Dividend Structure
print(type(dividend_data))
print(dividend_data.keys())
print(dividend_data["data"].keys())
This cell checks the structure of the dividend API response.
It prints the data type, the main keys, and the keys inside dividend_data["data"]. This step is important because API data is usually nested, so we need to understand its structure before processing it.
Cell 8 — Process Dividend Data
dividend_list = dividend_data["data"]["data"]["dividend"]

df_dividend = pd.DataFrame(dividend_list)
df_dividend["jenis_aksi"] = "Dividend"

df_dividend.head()
This cell extracts dividend data from the API response.
The dividend list is taken from dividend_data["data"]["data"]["dividend"], then converted into a DataFrame called df_dividend.
A new column called jenis_aksi is added with the value "Dividend".
Cell 9 — Check Columns
print("Kolom IPO:")
print(df_ipo.columns.tolist())

print("\nKolom Dividend:")
print(df_dividend.columns.tolist())
This cell displays all column names from both DataFrames.
This helps us know which columns are available before selecting, renaming, or visualizing the data.
Cell 10 — Combine Important Data
df_ipo_simple = df_ipo[["company_symbol", "company_name", "ipo_listing_date", "jenis_aksi"]].copy()
df_ipo_simple = df_ipo_simple.rename(columns={
    "company_symbol": "kode_saham",
    "company_name": "nama_perusahaan",
    "ipo_listing_date": "tanggal"
})

# Cari kolom tanggal dividend secara otomatis
kolom_tanggal_dividend = None

for kolom in df_dividend.columns:
    if "date" in kolom.lower() or "tanggal" in kolom.lower():
        kolom_tanggal_dividend = kolom
        break

df_dividend_simple = df_dividend.copy()

if kolom_tanggal_dividend:
    df_dividend_simple = df_dividend_simple.rename(columns={
        kolom_tanggal_dividend: "tanggal"
    })

# Cari kolom kode saham dividend secara otomatis
kolom_kode_dividend = None

for kolom in df_dividend_simple.columns:
    if "symbol" in kolom.lower() or "code" in kolom.lower() or "ticker" in kolom.lower():
        kolom_kode_dividend = kolom
        break

if kolom_kode_dividend:
    df_dividend_simple = df_dividend_simple.rename(columns={
        kolom_kode_dividend: "kode_saham"
    })

kolom_ambil = ["kode_saham", "tanggal", "jenis_aksi"]
df_dividend_simple = df_dividend_simple[[kolom for kolom in kolom_ambil if kolom in df_dividend_simple.columns]]

df_gabungan = pd.concat([df_ipo_simple, df_dividend_simple], ignore_index=True)

df_gabungan.head()
This cell prepares and combines IPO and dividend data.
First, the IPO data is simplified by selecting important columns, then renaming them into common names such as kode_saham, nama_perusahaan, and tanggal.
For dividend data, the code automatically searches for a date column and a stock code column. This makes the notebook more flexible because API column names may vary.
After that, both datasets are combined into one DataFrame called df_gabungan.
Cell 11 — Visualize IPO and Dividend Count
jumlah_aksi = df_gabungan["jenis_aksi"].value_counts()

plt.figure(figsize=(8, 5))
jumlah_aksi.plot(kind="bar")
plt.title("Jumlah IPO dan Dividend")
plt.xlabel("Jenis Aksi")
plt.ylabel("Jumlah Data")
plt.xticks(rotation=0)
plt.show()
This cell creates a bar chart showing the number of IPO and Dividend records.
The value_counts() function counts how many rows belong to each corporate action type. Then the result is displayed as a bar chart.
This visualization helps compare whether IPO or Dividend data appears more frequently in the dataset.
Cell 13 — Top 10 Dividend Based on Dividend Value
# Cek kolom dividend
print("Kolom Dividend:")
print(df_dividend.columns.tolist())

# Daftar kemungkinan nama kolom nilai dividend
calon_kolom_nilai = [
    "cash_dividend",
    "dividend_value",
    "dividend",
    "amount",
    "value",
    "dividend_amount",
    "dividend_cash",
    "cashDividend",
    "dividendValue"
]

# Cari kolom nilai dividend
kolom_nilai_dividend = None

for kolom in calon_kolom_nilai:
    if kolom in df_dividend.columns:
        kolom_nilai_dividend = kolom
        break

# Jika ketemu kolom nilai dividend
if kolom_nilai_dividend:
    print("Kolom nilai dividend yang digunakan:", kolom_nilai_dividend)

    df_dividend["nilai_dividend"] = (
        df_dividend[kolom_nilai_dividend]
        .astype(str)
        .str.replace(",", "", regex=False)
        .str.replace("Rp", "", regex=False)
        .str.replace("IDR", "", regex=False)
        .str.strip()
    )

    df_dividend["nilai_dividend"] = pd.to_numeric(
        df_dividend["nilai_dividend"],
        errors="coerce"
    )

    top_dividend = df_dividend.dropna(subset=["nilai_dividend"]).sort_values(
        "nilai_dividend",
        ascending=False
    ).head(10)

    if len(top_dividend) > 0:
        plt.figure(figsize=(12, 6))
        plt.bar(top_dividend["company_symbol"], top_dividend["nilai_dividend"])
        plt.title("Top 10 Dividend Berdasarkan Nilai")
        plt.xlabel("Kode Saham")
        plt.ylabel("Nilai Dividend")
        plt.xticks(rotation=45)
        plt.show()
    else:
        print("Data nilai dividend kosong setelah dikonversi.")
        print(df_dividend[[kolom_nilai_dividend]].head())

else:
    print("Kolom nilai dividend tidak ditemukan.")
    print("Silakan cek nama kolom yang tersedia di atas.")
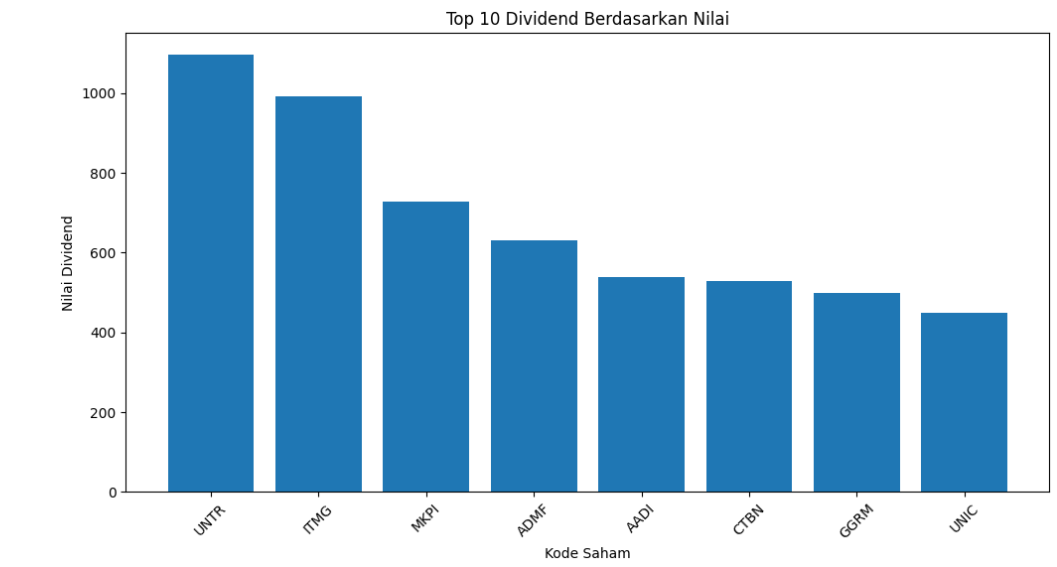
This cell analyzes dividend values.
First, the code prints all dividend columns. Then it creates a list of possible column names that may contain dividend value information.
The code searches for the correct dividend value column automatically. If found, the values are cleaned by removing commas, Rp, and IDR, then converted into numeric format.
After that, the data is sorted from the highest dividend value to the lowest, and the top 10 results are visualized using a bar chart.
If no valid dividend value column is found, the notebook prints a message asking the user to check the available columns.
Result :
Cell 14 — Analysis Conclusion
print("KESIMPULAN ANALISIS")
print("- Jumlah data IPO:", len(df_ipo))
print("- Jumlah data Dividend:", len(df_dividend))
print("- Total data gabungan:", len(df_gabungan))

if "nilai_dividend" in df_dividend.columns:
    print("- Data dividend yang memiliki nilai valid:", df_dividend["nilai_dividend"].notna().sum())

if "harga_ipo" in df_ipo.columns:
    print("- Rata-rata harga IPO:", df_ipo["harga_ipo"].mean())

if "tanggal" in df_gabungan.columns:
    print("- Periode data awal:", df_gabungan["tanggal"].min())
    print("- Periode data akhir:", df_gabungan["tanggal"].max())
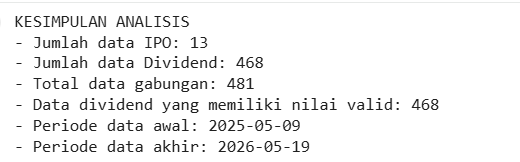
This final cell prints the summary of the analysis.
It shows the total IPO data, total Dividend data, and total combined data.
If the nilai_dividend column exists, it also shows how many dividend records have valid values.
If the harga_ipo column exists, it prints the average IPO price.
If the tanggal column exists, it displays the earliest and latest dates in the combined dataset.
Result:
Conclusion
dividend calendar IPO calendar data analysis Python API helps beginners understand how to collect and analyze corporate action data using Python. By combining IPO Calendar and Dividend Calendar data, we can compare corporate action activity, identify dividend records, and visualize important insights.
This notebook shows a complete workflow from API request to data processing, data combination, visualization, and final summary. The workflow can be expanded into a financial dashboard, investment screening tool, or corporate action monitoring system.