
Introduction
dividend calendar bonus calendar data analysis Python API is a practical way to analyze corporate action data using Python. Dividend data helps investors see companies that distribute profit to shareholders, while bonus calendar data helps identify companies that give bonus shares.
In this tutorial, we will use Python in Google Colab to fetch Dividend Calendar and Bonus Calendar data from an API. Then, we will process the API response, convert it into DataFrames, combine both datasets, and create visualizations to understand the data more clearly.
Cell 1 — Import Library
import requests
import pandas as pd
import matplotlib.pyplot as plt
import time
This cell imports the required libraries.
requests is used to fetch data from the API. pandas is used to process data into table format. matplotlib.pyplot is used to create visualizations. time is used to add delay before API requests.
Cell 2 — API Key Configuration
RAPIDAPI_KEY = "YOUR_RAPIDAPI_KEY_HERE"

headers = {
    "Content-Type": "application/json",
    "x-rapidapi-host": "indonesia-stock-exchange-idx.p.rapidapi.com",
    "x-rapidapi-key": RAPIDAPI_KEY
}
This cell prepares the API authentication.
The RAPIDAPI_KEY is your private RapidAPI key. The headers variable contains the information needed to access the API.
Cell 3 — API URL
dividend_url = "https://indonesia-stock-exchange-idx.p.rapidapi.com/api/calendar/dividend"
bonus_url = "https://indonesia-stock-exchange-idx.p.rapidapi.com/api/calendar/bonus"
This cell defines two API endpoints.
dividend_url is used to get dividend calendar data, while bonus_url is used to get bonus calendar data.
Cell 4 — Function to Fetch API Data
def get_api_data(url):
    time.sleep(2)

    response = requests.get(url, headers=headers)

    if response.status_code == 200:
        return response.json()
    else:
        print("Gagal mengambil data:", response.status_code)
        print(response.text)
        return None
This function is used to fetch data from the API.
The function waits for 2 seconds using time.sleep(2), sends a request to the API, checks the response status, and returns JSON data if the request is successful.
Cell 5 — Fetch Dividend and Bonus Data
dividend_data = get_api_data(dividend_url)
bonus_data = get_api_data(bonus_url)
This cell runs the API request function for both endpoints.
dividend_data stores the dividend API response, while bonus_data stores the bonus API response.
Cell 6 — Check Data Structure
print("Dividend Data:")
print(type(dividend_data))
print(dividend_data.keys())

print("\nBonus Data:")
print(type(bonus_data))
print(bonus_data.keys())
This cell checks the structure of the API response.
It prints the data type and available keys from both dividend_data and bonus_data. This is useful because API data is usually nested.
Cell 7 — Function to Extract List from Response
def cari_list_data(data, path="root"):
    if isinstance(data, list):
        print("List ditemukan di:", path)
        return data

    if isinstance(data, dict):
        for key, value in data.items():
            hasil = cari_list_data(value, path + " -> " + str(key))
            if len(hasil) > 0:
                return hasil

    return []
This cell creates a function to automatically find list data inside a nested API response.
For beginners, this is helpful because we do not always know exactly where the main data list is located inside JSON.
Cell 8 — Process Dividend Data
dividend_list = cari_list_data(dividend_data)

df_dividend = pd.DataFrame(dividend_list)
df_dividend["jenis_aksi"] = "Dividend"

df_dividend.head()
This cell extracts dividend data and converts it into a DataFrame.
A new column called jenis_aksi is added with the value "Dividend" so the dataset can be identified later.
Cell 9 — Process Bonus Data
bonus_list = cari_list_data(bonus_data)

df_bonus = pd.DataFrame(bonus_list)
df_bonus["jenis_aksi"] = "Bonus"

df_bonus.head()
This cell extracts bonus data and converts it into a DataFrame.
A new column called jenis_aksi is added with the value "Bonus".
Cell 10 — Check Columns
print("Kolom Dividend:")
print(df_dividend.columns.tolist())

print("\nKolom Bonus:")
print(df_bonus.columns.tolist())
This cell displays all columns from both DataFrames.
This step is important before analysis because it helps us know what data fields are available.
Cell 11 — Combine Data
df_gabungan = pd.concat([df_dividend, df_bonus], ignore_index=True, sort=False)

df_gabungan.head()
This cell combines dividend and bonus data into one DataFrame.
pd.concat() merges both datasets vertically. The result is stored in df_gabungan.
Cell 12 — Visualize Dividend and Bonus Data Count
jumlah_aksi = df_gabungan["jenis_aksi"].value_counts()

plt.figure(figsize=(8, 5))
jumlah_aksi.plot(kind="bar")
plt.title("Jumlah Data Dividend dan Bonus")
plt.xlabel("Jenis Aksi")
plt.ylabel("Jumlah Data")
plt.xticks(rotation=0)
plt.show()
This cell creates a bar chart showing the number of Dividend and Bonus records.
The chart makes it easier to compare which corporate action has more data.
Cell 13 — Visualize Dividend and Bonus per Month
# Buat kolom tanggal gabungan
df_gabungan["tanggal"] = None

# Isi tanggal untuk Dividend
if "dividend_cumdate" in df_gabungan.columns:
    df_gabungan.loc[
        df_gabungan["jenis_aksi"] == "Dividend",
        "tanggal"
    ] = df_gabungan["dividend_cumdate"]

# Isi tanggal untuk Bonus
if "stocksplit_cumdate" in df_gabungan.columns:
    df_gabungan.loc[
        df_gabungan["jenis_aksi"] == "Bonus",
        "tanggal"
    ] = df_gabungan["stocksplit_cumdate"]

# Convert ke datetime
df_gabungan["tanggal"] = pd.to_datetime(df_gabungan["tanggal"], errors="coerce")

# Bersihkan data tanggal kosong
df_clean = df_gabungan.dropna(subset=["tanggal"]).copy()

# Buat kolom bulan
df_clean["bulan"] = df_clean["tanggal"].dt.to_period("M").astype(str)

# Hitung jumlah per bulan
data_bulanan = df_clean.groupby(["bulan", "jenis_aksi"]).size().unstack(fill_value=0)

# Visualisasi
data_bulanan.plot(kind="bar", figsize=(12, 6))
plt.title("Jumlah Dividend dan Bonus per Bulan")
plt.xlabel("Bulan")
plt.ylabel("Jumlah Data")
plt.xticks(rotation=45)
plt.show()
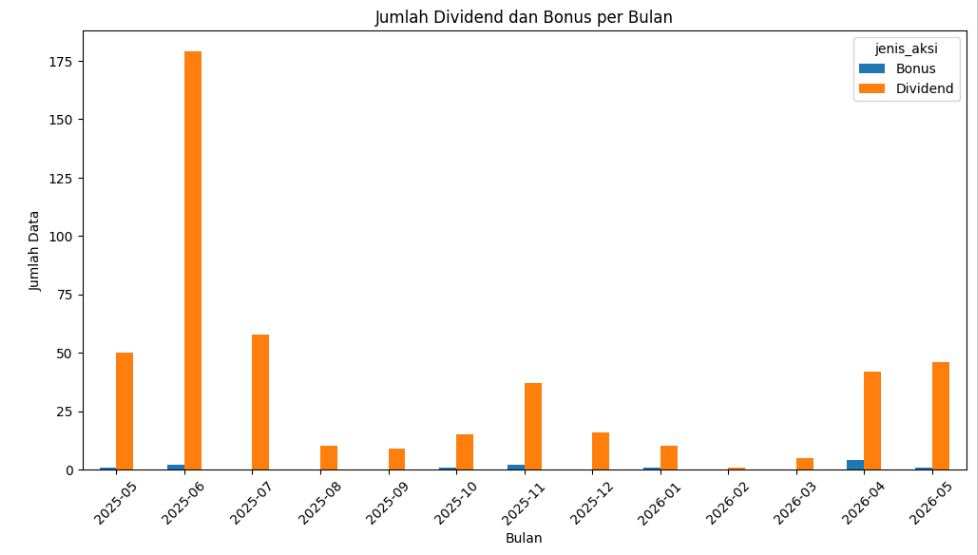
This cell analyzes dividend and bonus activity by month.
The code creates a combined date column, fills it using dividend and bonus date columns, converts it into datetime format, cleans missing dates, creates a monthly column, groups the data, and visualizes it as a bar chart.
Result:
Cell 14 — Top 10 Dividend Based on Value
calon_kolom_nilai = [
    "cash_dividend",
    "dividend_value",
    "dividend",
    "amount",
    "value",
    "dividend_amount",
    "dividend_cash",
    "cashDividend",
    "dividendValue"
]

kolom_nilai = None

for kolom in calon_kolom_nilai:
    if kolom in df_dividend.columns:
        kolom_nilai = kolom
        break

if kolom_nilai:
    df_dividend["nilai_dividend"] = (
        df_dividend[kolom_nilai]
        .astype(str)
        .str.replace(",", "", regex=False)
        .str.replace("Rp", "", regex=False)
        .str.replace("IDR", "", regex=False)
        .str.strip()
    )

    df_dividend["nilai_dividend"] = pd.to_numeric(df_dividend["nilai_dividend"], errors="coerce")

    top_dividend = df_dividend.dropna(subset=["nilai_dividend"]).sort_values(
        "nilai_dividend", ascending=False
    ).head(10)

    plt.figure(figsize=(12, 6))
    plt.bar(top_dividend.iloc[:, 0].astype(str), top_dividend["nilai_dividend"])
    plt.title("Top 10 Dividend Berdasarkan Nilai")
    plt.xlabel("Kode Saham")
    plt.ylabel("Nilai Dividend")
    plt.xticks(rotation=45)
    plt.show()
else:
    print("Kolom nilai dividend tidak ditemukan.")
    print(df_dividend.columns.tolist())
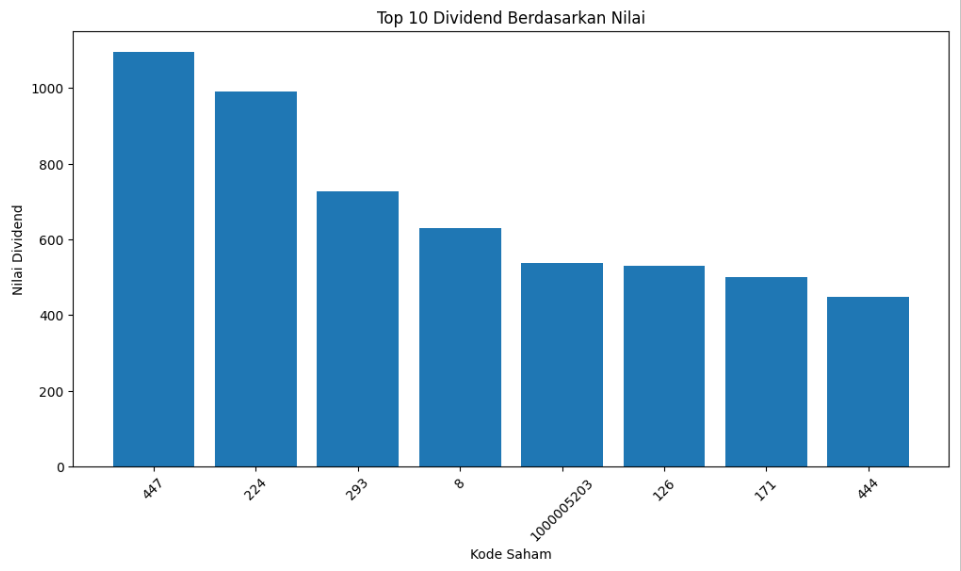
This cell finds and visualizes the top 10 dividend values.
The code searches for possible dividend value columns, cleans the value format, converts it into numeric data, sorts it from highest to lowest, and displays the top 10 results in a bar chart.
Result:
Cell 15 — Conclusion
print("KESIMPULAN ANALISIS")
print("- Jumlah data Dividend:", len(df_dividend))
print("- Jumlah data Bonus:", len(df_bonus))
print("- Total data gabungan:", len(df_gabungan))

if "nilai_dividend" in df_dividend.columns:
    print("- Nilai dividend tertinggi:", df_dividend["nilai_dividend"].max())

print("\nAnalisis selesai. Data Dividend dan Bonus berhasil diolah dan divisualisasikan.")
This final cell prints the analysis summary.
It shows the number of dividend records, bonus records, total combined data, and the highest dividend value if the nilai_dividend column exists.
Result :

Conclusion
dividend calendar bonus calendar data analysis Python API helps beginners understand how to fetch, process, combine, and visualize corporate action data using Python.
By using this notebook, we can compare Dividend and Bonus data, analyze monthly activity, and identify the highest dividend values. This workflow can be developed further into a financial dashboard, corporate action monitoring system, or investment research tool.