The cryptocurrency market operates continuously and is characterized by substantial price volatility, rapid changes in market sentiment, and differences in trading behavior across digital assets. These characteristics create challenges for traders who need to monitor multiple cryptocurrencies and evaluate market conditions within a consistent analytical framework.
Technical analysis provides a systematic approach to examining historical market behavior through mathematical indicators. Different technical indicators evaluate different aspects of market conditions, including trend direction, momentum, volatility, and trading volume.
Moving average indicators, such as Simple Moving Average (SMA), Exponential Moving Average (EMA), and Weighted Moving Average (WMA), are commonly used to examine market trends. Momentum indicators, including Relative Strength Index (RSI), Moving Average Convergence Divergence (MACD), Stochastic KD, Williams %R, and Commodity Channel Index (CCI), provide information about the strength and direction of price movements.
Other indicators provide additional analytical perspectives. Bollinger Bands measure price dispersion relative to a moving average, while Average True Range (ATR) estimates market volatility. Average Directional Index (ADX) evaluates trend strength, whereas Money Flow Index (MFI) and On-Balance Volume (OBV) incorporate volume-related information. Volume Weighted Average Price (VWAP) and Ichimoku provide further market reference measurements.
However, interpreting multiple indicators independently can produce conflicting signals. A cryptocurrency may exhibit bullish moving average conditions while simultaneously showing neutral or bearish momentum. Therefore, combining several indicators into a unified analytical framework can help organize different technical observations.
This article presents the Crypto Trader Intelligence System, a Python-based multi-asset technical analysis framework developed using the MarketFlow All-in-One Market Finance API through RapidAPI.
The system analyzes three cryptocurrency assets: Bitcoin (BTC), Ethereum (ETH), and Solana (SOL). It retrieves technical indicator information through two API endpoints:
/tools/indicator/listto discover available technical indicators./tools/indicatorto retrieve indicator values for individual cryptocurrency assets.
The analytical framework incorporates 15 technical indicators: SMA, EMA, WMA, RSI, MACD, BB, KD, ATR, ADX, WilliamsR, CCI, MFI, OBV, VWAP, and Ichimoku.
The retrieved indicator values are normalized into structured Pandas DataFrames and organized according to cryptocurrency assets. A multi-indicator voting mechanism subsequently evaluates bullish, bearish, and neutral conditions.
Based on the directional voting results, each cryptocurrency receives a bullish score, bearish score, market bias, and trading signal classification. The system also generates individual technical indicator assessments and visualizes market conditions through an automated dashboard.
The primary objective is to develop an integrated Python framework that combines multi-asset technical indicator retrieval, signal classification, market scanning, and visualization into a reproducible cryptocurrency trading intelligence workflow.
2. Methodology
The Crypto Trader Intelligence System consists of five computational cells. Each cell performs a specific function within the data retrieval, validation, technical analysis, signal generation, and visualization workflow.
Cell | Main function |
|---|---|
Cell 1 | Library installation, API configuration, asset selection, and indicator parameters. |
Cell 2 | API connection, indicator discovery, and BTC SMA testing. |
Cell 3 | Indicator response processing, metadata extraction, and data quality validation. |
Cell 4 | Retrieval and integration of 15 indicators for BTC, ETH, and SOL. |
Cell 5 | Multi-indicator voting, trading signals, dashboard visualization, and CSV export. |
2.1. System Configuration and API Integration
The system uses Python libraries including Requests, Pandas, NumPy, Matplotlib, JSON, Time, and Regular Expressions.
Requests handles HTTP communication with the MarketFlow API. Pandas manages structured indicator datasets, NumPy supports numerical operations, and Matplotlib generates technical analysis visualizations.
API authentication is performed using a RapidAPI key entered through Python's getpass module.
The initial asset configuration includes BTC, ETH, and SOL. The system also defines the required technical indicator parameters, including RSI period, MACD fast and slow periods, signal period, Bollinger Band standard deviation, and Ichimoku configuration.
Code — Cell 1: Configuration and API Setup
# ============================================================
# CELL 1 — CRYPTO TRADER INTELLIGENCE
# MARKETFLOW API
# ============================================================

!pip -q install requests pandas numpy matplotlib

import requests
import pandas as pd
import numpy as np
import matplotlib.pyplot as plt
import json
import time
import re
import getpass
from IPython.display import display, Markdown

# API CONFIGURATION
BASE_URL = "https://marketflow-all-in-one-market-finance-api.p.rapidapi.com"
API_HOST = "marketflow-all-in-one-market-finance-api.p.rapidapi.com"

API_KEY = getpass.getpass("Masukkan RapidAPI Key: ")

HEADERS = {
    "x-rapidapi-key": API_KEY,
    "x-rapidapi-host": API_HOST
}

ENDPOINTS = {
    "INDICATOR": "/tools/indicator",
    "INDICATOR_LIST": "/tools/indicator/list"
}

# ASSET CONFIGURATION
ASSETS = ["BTC", "ETH", "SOL"]

# TECHNICAL INDICATORS
INDICATORS = ["SMA", "EMA", "RSI", "MACD", "BBANDS"]

# INDICATOR PARAMETERS
INDICATOR_PARAMS = {
    "kPeriod": 14,
    "spanBPeriod": 52,
    "displacement": 26,
    "signalPeriod": 9,
    "stdDev": 2,
    "dPeriod": 3,
    "basePeriod": 26,
    "fastPeriod": 12,
    "period": 14,
    "slowPeriod": 26,
    "conversionPeriod": 9,
    "type": "crypto"
}

pd.set_option("display.max_columns", None)
pd.set_option("display.width", 180)

print("=" * 65)
print("       CRYPTO TRADER INTELLIGENCE SYSTEM")
print("=" * 65)
print("Assets:", ASSETS)
print("Indicators:", INDICATORS)
print("API Configuration: READY")
2.2. API Connection and Indicator Discovery
The second computational cell establishes communication with the MarketFlow API.
The marketflow_request() function handles HTTP GET requests, authentication headers, query parameters, and response validation.
The system initially accesses /tools/indicator/list to retrieve the available technical indicator definitions.
It then performs a test request using BTC and the SMA indicator. This test verifies whether the indicator endpoint can return numerical values and associated metadata.
The API connection report displays the connection status of both endpoints.
This initial validation is important because subsequent multi-asset calculations depend on successful API communication.
Code — Cell 2: API Connection and Indicator Discovery
# ============================================================
# CELL 2 — API CONNECTION & INDICATOR DISCOVERY
# ============================================================

def marketflow_request(endpoint, params=None):

    url = BASE_URL + endpoint

    response = requests.get(
        url,
        headers=HEADERS,
        params=params,
        timeout=45
    )

    response.raise_for_status()

    return response.json()


# ------------------------------------------------------------
# 1. GET AVAILABLE INDICATORS
# ------------------------------------------------------------

print("Connecting to MarketFlow API...")

try:

    indicator_list_raw = marketflow_request(
        ENDPOINTS["INDICATOR_LIST"]
    )

    print("\nINDICATOR LIST: SUCCESS")

    print(json.dumps(
        indicator_list_raw,
        indent=2
    )[:4000])

except Exception as e:

    indicator_list_raw = None

    print("INDICATOR LIST ERROR:", e)


# ------------------------------------------------------------
# 2. TEST BTC SMA
# ------------------------------------------------------------

try:

    test_params = {
        **INDICATOR_PARAMS,
        "indicator": "SMA",
        "symbol": "BTC"
    }

    btc_test_raw = marketflow_request(
        ENDPOINTS["INDICATOR"],
        test_params
    )

    print("\nBTC SMA: SUCCESS")

    print(json.dumps(
        btc_test_raw,
        indent=2
    )[:2500])

except Exception as e:

    btc_test_raw = None

    print("\nBTC SMA ERROR:", e)


print("\n" + "=" * 65)
print("API CONNECTION REPORT")
print("=" * 65)

print("Indicator List:",
      "CONNECTED" if indicator_list_raw is not None else "FAILED")

print("Indicator Endpoint:",
      "CONNECTED" if btc_test_raw is not None else "FAILED")
2.3. Indicator Data Processing and Validation
The third computational cell processes the indicator discovery response and the initial BTC SMA test response.
The extract_records() function converts the indicator list into a Pandas DataFrame. The available indicator information is displayed using the fields name, category, description, and requiredParams.
The parse_indicator() function extracts numerical values from the data.values field and attaches API metadata, including symbol, indicator name, timeframe, and timestamp.
The get_indicator_metadata() function retrieves additional information such as the indicator description, calculation period, and request identifier.
The system subsequently generates a data quality report containing:
Total observations.
Valid values.
Missing values.
Latest SMA value.
Minimum SMA value.
Maximum SMA value.
Timeframe.
Cryptocurrency symbol.
This process provides an initial assessment of data completeness and API response structure before the multi-asset analysis begins.
Code — Cell 3: Data Processing and Validation
# ============================================================
# CELL 3 — API DATA PROCESSING & VALIDATION
# ============================================================

# 1. NORMALIZE INDICATOR LIST

indicator_list_df = extract_records(indicator_list_raw)

print("AVAILABLE INDICATORS")
display(indicator_list_df[
    ["name", "category", "description", "requiredParams"]
])


# 2. EXTRACT INDICATOR RESPONSE

def parse_indicator(raw):

    if not isinstance(raw, dict):
        return pd.DataFrame()

    data = raw.get("data", {})

    if not isinstance(data, dict):
        return pd.DataFrame()

    values = data.get("values", [])

    if not isinstance(values, list):
        return pd.DataFrame()

    df = pd.DataFrame({
        "value": pd.to_numeric(
            pd.Series(values), errors="coerce"
        )
    })

    # API metadata
    df["symbol"] = raw.get("symbol")
    df["indicator"] = raw.get("indicator")
    df["timeframe"] = raw.get("timeframe")
    df["timestamp"] = raw.get("timestamp")

    return df


# 3. PARSE BTC SMA TEST

btc_sma_df = parse_indicator(btc_test_raw)

print("\nBTC SMA PARSED DATA")

display(btc_sma_df.head(10))


# 4. INDICATOR METADATA

def get_indicator_metadata(raw):

    if not isinstance(raw, dict):
        return {}

    data = raw.get("data", {})

    return {
        "symbol": raw.get("symbol"),
        "indicator": raw.get("indicator"),
        "timeframe": raw.get("timeframe"),
        "timestamp": raw.get("timestamp"),
        "description": data.get("metadata", {}).get("description"),
        "period": data.get("metadata", {}).get("period"),
        "request_id": raw.get("requestId")
    }


btc_metadata = get_indicator_metadata(btc_test_raw)

print("\nBTC SMA METADATA")

display(pd.DataFrame([btc_metadata]))


# 5. DATA QUALITY CHECK

if not btc_sma_df.empty:

    quality = {
        "Total Observations": len(btc_sma_df),
        "Valid Values": btc_sma_df["value"].notna().sum(),
        "Missing Values": btc_sma_df["value"].isna().sum(),
        "Latest SMA": btc_sma_df["value"].dropna().iloc[-1],
        "Minimum SMA": btc_sma_df["value"].min(),
        "Maximum SMA": btc_sma_df["value"].max(),
        "Timeframe": btc_metadata["timeframe"],
        "Symbol": btc_metadata["symbol"]
    }

    print("\nDATA QUALITY REPORT")

    display(pd.DataFrame([quality]))

else:

    print("BTC SMA DATA EMPTY")


print("\nCELL 3 VALIDATION COMPLETED")
2.4. Multi-Asset Technical Indicator Engine
The fourth computational cell performs the main technical analysis across BTC, ETH, and SOL.
The system expands the initial indicator configuration into 15 technical indicators:
Category | Indicators |
|---|---|
Trend | SMA, EMA, WMA, Ichimoku |
Momentum | RSI, MACD, KD, Williams %R, CCI |
Volume | MFI, OBV, VWAP |
Volatility and trend strength | ATR, ADX, Bollinger Bands |
Each indicator has its own parameter configuration. For example, RSI uses a 14-period setting, MACD uses 12, 26, and 9 periods, and Bollinger Bands use a 20-period calculation with a standard deviation of 2.
The flatten_indicator_values() function handles nested API indicator responses. It converts nested dictionaries and arrays into numerical series that can be processed using Pandas.
The parse_marketflow_response() function then extracts the numerical indicator components and converts them into structured DataFrames.
The system loops through all three cryptocurrency assets and requests each indicator individually. API responses, parsed DataFrames, and request statuses are stored separately for subsequent analysis.
The resulting indicator datasets are aligned by their observation indices and combined into unified DataFrames for each cryptocurrency.
This process provides a multi-asset analytical structure containing the available technical indicator values for BTC, ETH, and SOL.
Code — Cell 4: Full Multi-Asset Indicator Engine
# ============================================================
# CELL 4 — MULTI-ASSET INDICATOR ENGINE
# MARKETFLOW API | 15 TECHNICAL INDICATORS
# ============================================================

# 1. INDICATOR CONFIGURATION

INDICATORS = [
    "SMA", "EMA", "WMA",
    "RSI", "MACD", "BB",
    "KD", "ATR", "ADX",
    "WilliamsR", "CCI",
    "MFI", "OBV", "VWAP",
    "Ichimoku"
]

ASSETS = ["BTC", "ETH", "SOL"]

# Only send the parameters required by each indicator
INDICATOR_CONFIG = {
    "SMA": {"period": 14},
    "EMA": {"period": 14},
    "WMA": {"period": 14},
    "RSI": {"period": 14},
    "MACD": {
        "fastPeriod": 12,
        "slowPeriod": 26,
        "signalPeriod": 9
    },
    "BB": {"period": 20, "stdDev": 2},
    "KD": {"kPeriod": 14, "dPeriod": 3},
    "ATR": {"period": 14},
    "ADX": {"period": 14},
    "WilliamsR": {"period": 14},
    "CCI": {"period": 20},
    "MFI": {"period": 14},
    "OBV": {},
    "VWAP": {},
    "Ichimoku": {
        "conversionPeriod": 9,
        "basePeriod": 26,
        "spanBPeriod": 52,
        "displacement": 26
    }
}

# 2. FLEXIBLE RESPONSE PARSER

def flatten_indicator_values(values, prefix=""):

    output = {}

    if isinstance(values, dict):

        for key, value in values.items():

            name = f"{prefix}_{key}" if prefix else str(key)

            if isinstance(value, (list, tuple, np.ndarray, pd.Series)):

                if len(value) > 0 and isinstance(value[0], dict):

                    nested = pd.json_normalize(value)

                    for col in nested.columns:
                        output[f"{name}_{col}"] = nested[col].tolist()

                else:
                    output[name] = list(value)

            elif isinstance(value, dict):

                output.update(
                    flatten_indicator_values(value, name)
                )

        return output

    if isinstance(values, list):

        if not values:
            return {}

        if isinstance(values[0], dict):

            frame = pd.json_normalize(values)

            return {
                str(col): frame[col].tolist()
                for col in frame.columns
            }

        output[prefix or "value"] = values

    return output


def parse_marketflow_response(raw, indicator):

    if not isinstance(raw, dict):
        return pd.DataFrame()

    data = raw.get("data", {})

    if not isinstance(data, dict):
        return pd.DataFrame()

    values = data.get("values")

    if values is None:
        return pd.DataFrame()

    components = flatten_indicator_values(values, indicator)

    if not components:
        return pd.DataFrame()

    series_dict = {}

    for name, values in components.items():

        if not isinstance(values, (list, tuple, np.ndarray)):
            continue

        series = pd.to_numeric(
            pd.Series(values),
            errors="coerce"
        )

        if series.notna().any():
            series_dict[str(name)] = series.reset_index(drop=True)

    if not series_dict:
        return pd.DataFrame()

    return pd.DataFrame(series_dict)


# 3. DOWNLOAD ALL INDICATORS

indicator_results = {}
indicator_frames = {}
indicator_status = []

print("=" * 75)
print("       MARKETFLOW MULTI-ASSET INDICATOR ENGINE")
print("=" * 75)

for symbol in ASSETS:

    print(f"\nANALYZING ASSET: {symbol}")

    indicator_results[symbol] = {}
    indicator_frames[symbol] = {}

    for indicator in INDICATORS:

        try:

            params = {
                "type": "crypto",
                "symbol": symbol,
                "indicator": indicator,
                **INDICATOR_CONFIG[indicator]
            }

            raw = marketflow_request(
                ENDPOINTS["INDICATOR"],
                params
            )

            parsed = parse_marketflow_response(
                raw,
                indicator
            )

            indicator_results[symbol][indicator] = raw
            indicator_frames[symbol][indicator] = parsed

            valid = not parsed.empty

            indicator_status.append({
                "Asset": symbol,
                "Indicator": indicator,
                "Status": "SUCCESS" if valid else "EMPTY",
                "Observations": len(parsed)
            })

            print(
                f"{indicator:<12} | "
                f"{'SUCCESS' if valid else 'EMPTY'} | "
                f"{len(parsed)} observations"
            )

        except Exception as e:

            indicator_results[symbol][indicator] = None
            indicator_frames[symbol][indicator] = pd.DataFrame()

            indicator_status.append({
                "Asset": symbol,
                "Indicator": indicator,
                "Status": "FAILED",
                "Observations": 0
            })

            print(f"{indicator:<12} | ERROR: {str(e)[:100]}")

        time.sleep(0.3)


# 4. BUILD UNIFIED DATAFRAME

unified_data = {}

for symbol in ASSETS:

    frames = []

    for indicator, frame in indicator_frames[symbol].items():

        if frame.empty:
            continue

        temp = frame.copy()

        temp.columns = [
            f"{indicator}__{col}"
            for col in temp.columns
        ]

        frames.append(temp)

    if frames:

        max_len = max(len(frame) for frame in frames)

        aligned_frames = []

        for frame in frames:

            frame = frame.reset_index(drop=True)

            frame.index = range(
                max_len - len(frame),
                max_len
            )

            aligned_frames.append(frame)

        unified_data[symbol] = pd.concat(
            aligned_frames,
            axis=1
        )

    else:

        unified_data[symbol] = pd.DataFrame()


# 5. REQUEST REPORT

indicator_status_df = pd.DataFrame(indicator_status)

print("\n" + "=" * 75)
print("INDICATOR REQUEST REPORT")
print("=" * 75)

display(indicator_status_df)

success_count = (
    indicator_status_df["Status"] == "SUCCESS"
).sum()

total_count = len(indicator_status_df)

print(f"\nSuccessful indicators: {success_count}/{total_count}")
print(f"Success rate: {success_count/total_count*100:.2f}%")

# 6. DATA PREVIEW

for symbol, df in unified_data.items():

    print(f"\n{symbol} UNIFIED DATA")

    if not df.empty:
        display(df.tail(5))
    else:
        print("No valid indicator data.")

print("\nCELL 4 COMPLETED")
2.5. Advanced Trader Intelligence and Signal Generation
The fifth computational cell performs the main trading intelligence analysis.
The system evaluates each cryptocurrency using a voting mechanism based on the available technical indicator outputs.
The first stage identifies individual indicator components through the find_component() and get_series() functions. These functions allow the system to retrieve indicator values from the unified DataFrames even when the API returns different nested component names.
The classify_slope() function evaluates the direction of a technical indicator over a three-observation lookback period. An increasing value is classified as BULLISH, a decreasing value as BEARISH, and a relatively unchanged value as NEUTRAL.
The signal engine evaluates multiple technical categories.
Trend analysis uses SMA, EMA, and WMA slopes, optional ADX directional components, and the relationship between Ichimoku conversion and base lines.
Momentum analysis evaluates RSI, MACD, Stochastic KD, Williams %R, and CCI.
Volume analysis incorporates MFI and OBV.
ADX strength and ATR are also retrieved as supplementary analytical measurements. Bollinger Band values are extracted to provide upper, middle, and lower reference levels.
Each directional indicator contributes a bullish, bearish, or neutral vote when sufficient data are available.
The bullish and bearish scores are calculated as:
\[ Bullish\ Score = \frac{Bullish\ Votes}{Bullish\ Votes+Bearish\ Votes} \times 100 \]
\[ Bearish\ Score = \frac{Bearish\ Votes}{Bullish\ Votes+Bearish\ Votes} \times 100 \]
The system then applies a confidence guard. If fewer than three directional votes are available, the asset is classified as INSUFFICIENT DATA and receives a WAIT signal.
Otherwise:
Bullish score of at least 65% generates BULLISH bias and WATCH BUY.
Bullish score of 35% or lower generates BEARISH bias and WATCH SELL.
Intermediate scores generate NEUTRAL bias and WAIT.
The resulting information is consolidated into a multi-asset signal table and an individual indicator signal table.
Code — Cell 5: Full Advanced Trader Intelligence Dashboard
# ============================================================
# CELL 5 — ADVANCED TRADER INTELLIGENCE DASHBOARD
# SIGNAL ENGINE | VISUALIZATION | EXPORT
# ============================================================

# ------------------------------------------------------------
# 1. HELPER FUNCTIONS
# ------------------------------------------------------------

def norm(text):

    return re.sub(
        r"[^a-z0-9]",
        "",
        str(text).lower()
    )


def find_component(df, indicator, keywords=None, exclude=None):

    if df.empty:
        return None

    keywords = keywords or []
    exclude = exclude or []

    prefix = indicator + "__"

    candidates = [
        col for col in df.columns
        if col.startswith(prefix)
    ]

    if not candidates:
        return None

    # Match component name
    for col in candidates:

        name = norm(col.split("__", 1)[-1])

        if (
            all(norm(x) in name for x in keywords)
            and not any(norm(x) in name for x in exclude)
        ):
            return col

    # Fallback for simple indicators
    if not keywords and len(candidates) == 1:
        return candidates[0]

    return None


def get_series(df, indicator, keywords=None, exclude=None):

    col = find_component(
        df,
        indicator,
        keywords,
        exclude
    )

    if col is None:
        return pd.Series(dtype=float)

    return pd.to_numeric(
        df[col],
        errors="coerce"
    ).dropna()


def latest_value(df, indicator, keywords=None, exclude=None):

    series = get_series(
        df,
        indicator,
        keywords,
        exclude
    )

    return series.iloc[-1] if not series.empty else np.nan


def classify_slope(series, lookback=3):

    series = series.dropna()

    if len(series) < lookback + 1:
        return "UNAVAILABLE"

    old = series.iloc[-(lookback + 1)]
    new = series.iloc[-1]

    if old == 0:
        return "NEUTRAL"

    change = (new - old) / abs(old)

    if change > 0.0005:
        return "BULLISH"

    elif change < -0.0005:
        return "BEARISH"

    return "NEUTRAL"


# ------------------------------------------------------------
# 2. SCORING ENGINE
# ------------------------------------------------------------

signal_records = []
indicator_signal_records = []

for symbol, df in unified_data.items():

    if df.empty:
        print(f"{symbol}: No data available.")
        continue

    bullish_votes = 0
    bearish_votes = 0
    neutral_votes = 0

    votes = []

    def add_signal(name, signal, group):

        nonlocal_dummy = None

        global_placeholder = None

        nonlocal_vars = None

        if signal == "BULLISH":
            bullish_votes_list.append((name, group))

        elif signal == "BEARISH":
            bearish_votes_list.append((name, group))

        elif signal == "NEUTRAL":
            neutral_votes_list.append((name, group))

        indicator_signal_records.append({
            "Asset": symbol,
            "Indicator": name,
            "Category": group,
            "Signal": signal
        })

    bullish_votes_list = []
    bearish_votes_list = []
    neutral_votes_list = []

    # --------------------------------------------------------
    # TREND ANALYSIS
    # --------------------------------------------------------

    for indicator in ["SMA", "EMA", "WMA"]:

        series = get_series(df, indicator)

        signal = classify_slope(series)

        add_signal(indicator, signal, "TREND")

    # ADX: trend strength, not directional by itself
    adx = latest_value(df, "ADX")

    adx_strength = (
        "STRONG" if adx >= 25
        else "WEAK" if not np.isnan(adx)
        else "UNAVAILABLE"
    )

    # Optional directional ADX components
    plus_di = latest_value(df, "ADX", ["plusdi"])
    minus_di = latest_value(df, "ADX", ["minusdi"])

    if not np.isnan(plus_di) and not np.isnan(minus_di):

        add_signal(
            "ADX_DIRECTION",
            "BULLISH" if plus_di > minus_di
            else "BEARISH" if plus_di < minus_di
            else "NEUTRAL",
            "TREND"
        )

    # ICHIMOKU: Conversion vs Base
    conversion = latest_value(
        df, "Ichimoku", ["conversion"]
    )

    base = latest_value(
        df, "Ichimoku", ["base"]
    )

    if not np.isnan(conversion) and not np.isnan(base):

        add_signal(
            "ICHIMOKU",
            "BULLISH" if conversion > base
            else "BEARISH" if conversion < base
            else "NEUTRAL",
            "TREND"
        )

    # --------------------------------------------------------
    # MOMENTUM ANALYSIS
    # --------------------------------------------------------

    rsi = latest_value(df, "RSI")

    if not np.isnan(rsi):

        if rsi >= 70:
            rsi_signal = "OVERBOUGHT"

        elif rsi <= 30:
            rsi_signal = "OVERSOLD"

        elif rsi >= 55:
            rsi_signal = "BULLISH"

        elif rsi <= 45:
            rsi_signal = "BEARISH"

        else:
            rsi_signal = "NEUTRAL"

        add_signal("RSI", rsi_signal, "MOMENTUM")

    else:
        rsi_signal = "UNAVAILABLE"

    # MACD
    macd = latest_value(
        df, "MACD", ["macd"], ["signal", "histogram"]
    )

    macd_signal_line = latest_value(
        df, "MACD", ["signal"]
    )

    if not np.isnan(macd) and not np.isnan(macd_signal_line):

        add_signal(
            "MACD",
            "BULLISH" if macd > macd_signal_line
            else "BEARISH" if macd < macd_signal_line
            else "NEUTRAL",
            "MOMENTUM"
        )

    # STOCHASTIC KD
    k_value = latest_value(df, "KD", ["k"])
    d_value = latest_value(df, "KD", ["d"])

    if not np.isnan(k_value) and not np.isnan(d_value):

        add_signal(
            "KD",
            "BULLISH" if k_value > d_value
            else "BEARISH" if k_value < d_value
            else "NEUTRAL",
            "MOMENTUM"
        )

    # WILLIAMS R
    williams = latest_value(df, "WilliamsR")

    if not np.isnan(williams):

        if williams > -50:
            wr_signal = "BULLISH"

        elif williams < -50:
            wr_signal = "BEARISH"

        else:
            wr_signal = "NEUTRAL"

        add_signal("WilliamsR", wr_signal, "MOMENTUM")

    else:
        wr_signal = "UNAVAILABLE"

    # CCI
    cci = latest_value(df, "CCI")

    if not np.isnan(cci):

        if cci > 100:
            cci_signal = "BULLISH"

        elif cci < -100:
            cci_signal = "BEARISH"

        else:
            cci_signal = "NEUTRAL"

        add_signal("CCI", cci_signal, "MOMENTUM")

    # --------------------------------------------------------
    # VOLUME ANALYSIS
    # --------------------------------------------------------

    mfi = latest_value(df, "MFI")

    if not np.isnan(mfi):

        if mfi > 55:
            mfi_signal = "BULLISH"

        elif mfi < 45:
            mfi_signal = "BEARISH"

        else:
            mfi_signal = "NEUTRAL"

        add_signal("MFI", mfi_signal, "VOLUME")

    else:
        mfi_signal = "UNAVAILABLE"

    obv_series = get_series(df, "OBV")

    obv_signal = classify_slope(obv_series)

    add_signal("OBV", obv_signal, "VOLUME")

    # --------------------------------------------------------
    # VOLATILITY
    # --------------------------------------------------------

    atr = latest_value(df, "ATR")

    bb_upper = latest_value(df, "BB", ["upper"])
    bb_middle = latest_value(df, "BB", ["middle"])
    bb_lower = latest_value(df, "BB", ["lower"])

    # Count directional votes
    bullish = len(bullish_votes_list)
    bearish = len(bearish_votes_list)
    neutral = len(neutral_votes_list)

    total_directional = bullish + bearish

    bullish_score = (
        bullish / total_directional * 100
        if total_directional > 0 else np.nan
    )

    bearish_score = (
        bearish / total_directional * 100
        if total_directional > 0 else np.nan
    )

    # Confidence guard
    if total_directional < 3:

        bias = "INSUFFICIENT DATA"
        action = "WAIT"

    elif bullish_score >= 65:

        bias = "BULLISH"
        action = "WATCH BUY"

    elif bullish_score <= 35:

        bias = "BEARISH"
        action = "WATCH SELL"

    else:

        bias = "NEUTRAL"
        action = "WAIT"

    # Market momentum summary
    signal_records.append({

        "Asset": symbol,

        "Bullish Votes": bullish,
        "Bearish Votes": bearish,
        "Neutral Votes": neutral,

        "Bullish Score (%)": bullish_score,
        "Bearish Score (%)": bearish_score,

        "Market Bias": bias,
        "Trading Signal": action,

        "RSI": rsi,
        "RSI Signal": rsi_signal,

        "MACD": macd,
        "MACD Signal": macd_signal_line,

        "KD K": k_value,
        "KD D": d_value,

        "WilliamsR": williams,
        "CCI": cci,

        "MFI": mfi,
        "OBV Signal": obv_signal,

        "ADX": adx,
        "ADX Strength": adx_strength,

        "ATR": atr,

        "BB Upper": bb_upper,
        "BB Middle": bb_middle,
        "BB Lower": bb_lower,

        "Directional Votes": total_directional
    })


# ------------------------------------------------------------
# 3. BUILD DASHBOARD TABLES
# ------------------------------------------------------------

signals_df = pd.DataFrame(signal_records)

indicator_signals_df = pd.DataFrame(
    indicator_signal_records
)

print("\n" + "=" * 75)
print("           CRYPTO TRADER INTELLIGENCE")
print("=" * 75)

if not signals_df.empty:

    signals_df = signals_df.sort_values(
        "Bullish Score (%)",
        ascending=False,
        na_position="last"
    )

    display(
        signals_df.round(3)
    )

else:

    print("No sufficient indicator data.")


# ------------------------------------------------------------
# 4. MARKET SCANNER
# ------------------------------------------------------------

print("\nMARKET SCANNER")

if not signals_df.empty:

    for _, row in signals_df.iterrows():

        print(
            f"{row['Asset']:<8} | "
            f"{row['Market Bias']:<20} | "
            f"Score: {row['Bullish Score (%)']:.2f}%"
            if pd.notna(row["Bullish Score (%)"])
            else f"{row['Asset']:<8} | INSUFFICIENT DATA"
        )

# ------------------------------------------------------------
# 5. INDICATOR SIGNAL DETAILS
# ------------------------------------------------------------

print("\nINDIVIDUAL INDICATOR SIGNALS")

if not indicator_signals_df.empty:

    display(
        indicator_signals_df.pivot_table(
            index="Asset",
            columns="Indicator",
            values="Signal",
            aggfunc="first"
        )
    )


# ------------------------------------------------------------
# 6. TECHNICAL CHART DASHBOARD
# ------------------------------------------------------------

for symbol, df in unified_data.items():

    if df.empty:
        continue

    fig, axes = plt.subplots(
        3, 1,
        figsize=(15, 11)
    )

    # MOVING AVERAGES
    for indicator in ["SMA", "EMA", "WMA"]:

        series = get_series(df, indicator)

        if not series.empty:
            axes[0].plot(
                series.index,
                series.values,
                label=indicator
            )

    axes[0].set_title(
        f"{symbol} - Trend Analysis"
    )

    axes[0].legend()
    axes[0].grid(alpha=0.3)

    # RSI
    rsi_series = get_series(df, "RSI")

    if not rsi_series.empty:

        axes[1].plot(
            rsi_series.index,
            rsi_series.values,
            label="RSI"
        )

        axes[1].axhline(
            70, linestyle="--", label="Overbought"
        )

        axes[1].axhline(
            30, linestyle="--", label="Oversold"
        )

        axes[1].axhline(
            50, linestyle=":", label="Midline"
        )

    axes[1].set_ylim(0, 100)
    axes[1].set_title(f"{symbol} - RSI")
    axes[1].legend()
    axes[1].grid(alpha=0.3)

    # MACD
    macd_series = get_series(
        df, "MACD", ["macd"], ["signal", "histogram"]
    )

    signal_series = get_series(
        df, "MACD", ["signal"]
    )

    if not macd_series.empty:

        axes[2].plot(
            macd_series.index,
            macd_series.values,
            label="MACD"
        )

    if not signal_series.empty:

        axes[2].plot(
            signal_series.index,
            signal_series.values,
            label="Signal"
        )

    axes[2].axhline(0, linestyle="--")
    axes[2].set_title(f"{symbol} - MACD")
    axes[2].legend()
    axes[2].grid(alpha=0.3)

    plt.tight_layout()
    plt.show()


# ------------------------------------------------------------
# 7. BULLISH SCORE CHART
# ------------------------------------------------------------

if not signals_df.empty:

    plot_df = signals_df.dropna(
        subset=["Bullish Score (%)"]
    )

    if not plot_df.empty:

        plt.figure(figsize=(10, 5))

        plt.bar(
            plot_df["Asset"],
            plot_df["Bullish Score (%)"]
        )

        plt.axhline(
            65, linestyle="--", label="Bullish Threshold"
        )

        plt.axhline(
            35, linestyle="--", label="Bearish Threshold"
        )

        plt.ylim(0, 100)

        plt.title("Multi-Asset Bullish Score")

        plt.ylabel("Score (%)")

        plt.legend()
        plt.grid(axis="y", alpha=0.3)

        plt.show()


# ------------------------------------------------------------
# 8. EXPORT ALL REPORTS
# ------------------------------------------------------------

signals_df.to_csv(
    "crypto_trading_signals.csv",
    index=False
)

indicator_signals_df.to_csv(
    "crypto_indicator_signals.csv",
    index=False
)

indicator_status_df.to_csv(
    "crypto_api_status.csv",
    index=False
)

for symbol, df in unified_data.items():

    df.to_csv(
        f"{symbol}_technical_data.csv",
        index=True
    )


# ------------------------------------------------------------
# 9. FINAL REPORT
# ------------------------------------------------------------

print("\n" + "=" * 75)
print("             ANALYSIS COMPLETED")
print("=" * 75)

print("Assets analyzed:", len(signals_df))
print("Indicators requested:", len(INDICATORS))
print("Total API requests:", len(indicator_status_df))

print("\nEXPORTED FILES:")

print("- crypto_trading_signals.csv")
print("- crypto_indicator_signals.csv")
print("- crypto_api_status.csv")

for symbol in ASSETS:
    print(f"- {symbol}_technical_data.csv")

print("\nTRADER INTELLIGENCE SYSTEM READY")
Result:
3. Results and Discussion
3.1. API Connectivity and Indicator Discovery
The API connectivity module establishes communication with the MarketFlow All-in-One Market Finance API.
The system retrieves the available indicator list and performs an initial SMA request for Bitcoin.
The API connection report distinguishes between successful and unsuccessful requests. This provides an initial assessment of endpoint availability before the multi-asset indicator engine is executed.
The indicator discovery process also provides information about indicator names, categories, descriptions, and required parameters.
These results help establish the available technical analysis components for subsequent processing.
3.2. Multi-Asset Technical Indicator Retrieval
The multi-asset indicator engine retrieves 15 technical indicators for three cryptocurrency assets: BTC, ETH, and SOL.
The total intended number of indicator requests is:
\[ 3\ Assets \times 15\ Indicators = 45\ Requests \]
Each request is executed independently, allowing the system to record its status and the number of observations returned.
The API request report classifies each indicator request into three possible outcomes:
SUCCESS: valid numerical indicator data are returned.
EMPTY: the response does not contain usable numerical observations.
FAILED: the API request or processing operation generates an error.
The system then combines the available indicator outputs into unified DataFrames for each cryptocurrency.
This structure makes it possible to evaluate multiple technical indicators without manually processing each API response.
3.3. Technical Indicator Analysis
The analytical framework incorporates 15 indicators grouped according to their primary analytical functions.
Indicator | Analytical function |
|---|---|
SMA | Identifies the general price trend. |
EMA | Evaluates recent price trends with exponential weighting. |
WMA | Evaluates price trends using weighted observations. |
RSI | Measures momentum and potential overbought or oversold conditions. |
MACD | Evaluates momentum through moving average relationships. |
BB | Measures price dispersion and volatility boundaries. |
KD | Evaluates stochastic momentum. |
ATR | Measures market volatility. |
ADX | Evaluates trend strength. |
Williams %R | Measures price momentum relative to its recent range. |
CCI | Identifies deviations from average price conditions. |
MFI | Evaluates volume-weighted buying and selling pressure. |
OBV | Examines cumulative volume direction. |
VWAP | Provides a volume-weighted average price reference. |
Ichimoku | Evaluates trend relationships using multiple reference lines. |
The combination of these indicators provides different analytical perspectives.
Trend indicators help identify directional market conditions, momentum indicators evaluate the strength of price movements, and volume-related indicators provide additional information about market participation.
ATR and ADX contribute volatility and trend-strength information, while Bollinger Bands and Ichimoku provide additional reference levels.
3.4. Multi-Indicator Voting Mechanism
The multi-indicator voting mechanism is the main analytical component of the system.
Each cryptocurrency is evaluated using the directional signals produced by available technical indicators.
The framework counts bullish, bearish, and neutral votes separately.
The bullish and bearish scores are calculated relative to the total number of directional votes.
For example, if an asset receives eight bullish votes and four bearish votes, the bullish score becomes:
\[ \frac{8}{8+4}\times100=66.67\% \]
The corresponding bearish score is 33.33%.
The system uses the following signal classification:
Bullish score | Market bias | Trading signal |
|---|---|---|
65% or higher | BULLISH | WATCH BUY |
35% or lower | BEARISH | WATCH SELL |
Above 35% and below 65% | NEUTRAL | WAIT |
Fewer than 3 directional votes | INSUFFICIENT DATA | WAIT |
This voting mechanism provides a systematic way to consolidate multiple technical observations into a single market assessment.
It is important to distinguish between a WATCH BUY signal and an actual BUY recommendation. The generated signal represents technical indicator agreement and should be confirmed through additional analysis and risk management.
3.5. Individual Indicator Signal Analysis
In addition to the aggregate voting results, the system generates an individual indicator signal table.
The table displays the classification of each evaluated indicator for BTC, ETH, and SOL.
The individual signal classifications include:
BULLISH.
BEARISH.
NEUTRAL.
OVERBOUGHT.
OVERSOLD.
UNAVAILABLE.
This additional output allows analysts to identify which indicators contribute to the overall market assessment.
For example, a cryptocurrency may receive a BULLISH classification from moving average indicators while RSI indicates an overbought condition.
Such differences are useful because they reveal situations in which technical indicators do not provide uniform market confirmation.
3.6. Market Scanner and Asset Comparison
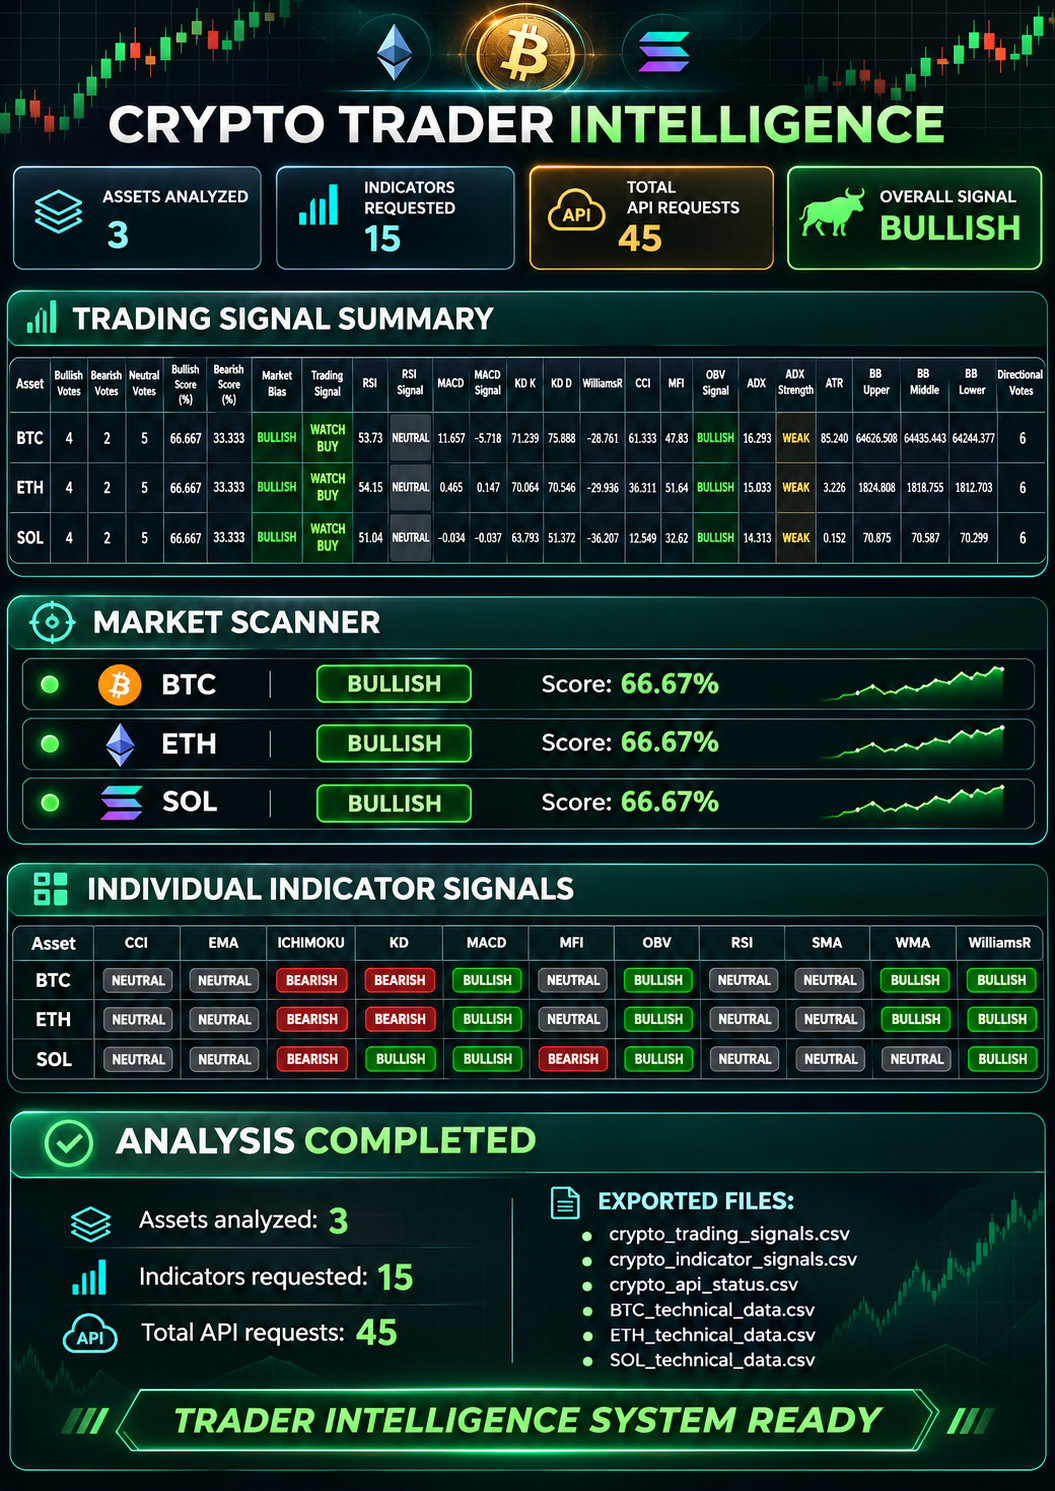
The market scanner organizes the final market bias and bullish score for all analyzed cryptocurrencies.
The assets are sorted according to their bullish scores in descending order.
This makes it possible to identify which cryptocurrency has the highest proportion of bullish directional votes at the time of analysis.
The scanner provides a comparative overview of BTC, ETH, and SOL without requiring the analyst to examine each indicator dataset separately.
However, a higher bullish score does not necessarily indicate a higher probability of profit. It represents the relative distribution of bullish and bearish votes under the predefined analytical rules.
3.7. Technical Dashboard Visualization
The framework generates individual technical dashboards for each cryptocurrency.
Each asset dashboard contains three analytical panels.
Trend Analysis: Displays SMA, EMA, and WMA series to illustrate the direction of moving average indicators.
RSI Analysis: Displays RSI values with reference levels at 30, 50, and 70.
MACD Analysis: Displays the MACD line and signal line to examine momentum relationships.
The system also generates a comparative bullish score chart for all assets.
Crypto Trader Intelligence Dashboard
Trend Analysis
SMA, EMA, and WMA comparison.
RSI Dashboard
Momentum and overbought/oversold levels.
MACD Analysis
MACD and signal-line relationships.
Bullish Score
Comparative BTC, ETH, and SOL scores.
Visualization components generated by the Python code. Actual charts and numerical values depend on API execution.
These visualizations provide an accessible overview of technical conditions across the three cryptocurrency assets.
3.8. Exported Analytical Outputs
The system generates the following CSV files:
Filename | Description |
|---|---|
| Consolidated market bias, scores, and trading signals. |
| Individual technical indicator classifications. |
| API request status and observation counts. |
| Unified Bitcoin indicator dataset. |
| Unified Ethereum indicator dataset. |
| Unified Solana indicator dataset. |
These datasets provide a structured record of the analytical results and can be used for further statistical analysis, historical comparisons, and trading research.
3.9. Limitations and Future Improvements
Several limitations should be considered when interpreting the analytical results.
First, indicator retrieval depends on API availability. Failed or incomplete API responses can reduce the number of available directional votes and affect the final market classification.
Second, the voting mechanism uses predefined rules. The thresholds for RSI, Williams %R, CCI, MFI, and bullish scores are rule-based parameters rather than statistically optimized values.
Third, some indicators are not included in directional voting. ATR, Bollinger Bands, and VWAP provide supplementary information in the current implementation. ADX contributes direction only when positive and negative directional components are available.
Fourth, indicator series are aligned using observation indices rather than verified timestamps. Consequently, series with different historical lengths may not represent identical observation dates.
Fifth, the current framework does not implement historical strategy backtesting. WATCH BUY and WATCH SELL classifications are technical screening outputs, not validated trading performance results.
Sixth, the current scoring mechanism does not assign different weights to indicators. Each accepted directional vote contributes equally to the bullish or bearish score.
Future improvements could include:
Timestamp-based indicator alignment.
Weighted multi-indicator scoring.
Historical trading signal backtesting.
Win rate and profit factor evaluation.
ATR-based stop-loss and take-profit calculations.
Transaction cost and slippage modeling.
Real-time cryptocurrency price integration.
Historical signal accuracy evaluation.
Machine learning-based signal optimization.
Automated Telegram trading alerts.
These improvements could expand the framework into a more comprehensive cryptocurrency trading intelligence platform.
4. Conclusion
This article presents the Crypto Trader Intelligence System, a Python-based multi-asset cryptocurrency analysis framework developed using the MarketFlow All-in-One Market Finance API through RapidAPI.
The system analyzes Bitcoin, Ethereum, and Solana using 15 technical indicators covering trend, momentum, volatility, and volume-related measurements.
The analytical workflow integrates API connection, indicator discovery, numerical data extraction, metadata processing, data quality validation, and multi-asset indicator retrieval.
The framework subsequently implements a multi-indicator voting mechanism to calculate bullish, bearish, and neutral directional conditions. These results are transformed into bullish scores, bearish scores, market bias classifications, and WATCH BUY, WATCH SELL, or WAIT signals.
The system also generates individual indicator assessments, a multi-asset market scanner, technical indicator visualizations, and comparative bullish score charts.
The final analytical outputs are exported into structured CSV datasets, providing a foundation for further cryptocurrency market research and automated monitoring.
Overall, the Crypto Trader Intelligence System demonstrates how Python and financial APIs can be integrated to develop an automated technical analysis framework for multiple cryptocurrency assets.
Although the current implementation provides a systematic method for organizing technical indicator information and generating preliminary trading signals, further validation through timestamp alignment, historical backtesting, risk management, and performance measurement is necessary before the system can be used as a complete trading decision platform.