
Cryptocurrency markets operate in a highly dynamic environment characterized by continuous price fluctuations, changing market sentiment, and varying levels of volatility. Bitcoin (BTC) and Ethereum (ETH), as two major digital assets, attract significant attention from traders and investors seeking to identify market trends, evaluate momentum, and develop systematic trading strategies.
Technical analysis plays an important role in cryptocurrency trading because it provides a structured approach to interpreting historical market indicators. Rather than relying exclusively on subjective market observations, traders can use mathematical indicators to evaluate price trends, identify potential momentum changes, and examine possible bullish or bearish market conditions.
Among the commonly used technical indicators are Simple Moving Average (SMA), Exponential Moving Average (EMA), Relative Strength Index (RSI), and Moving Average Convergence Divergence (MACD). SMA and EMA help evaluate trend direction, RSI measures momentum conditions, while MACD provides information about the relationship between short-term and long-term exponential moving averages.
Although these indicators are widely available on trading platforms, monitoring multiple indicators across several cryptocurrency assets can become increasingly complex. Differences in API response structures, missing observations, inconsistent indicator formats, and data synchronization issues can also complicate automated analysis.
Python provides an effective environment for addressing these challenges through automated financial data acquisition, data processing, indicator validation, and visualization. Libraries such as Requests, Pandas, NumPy, Matplotlib, and Seaborn support the development of integrated analytical systems that can retrieve and process financial information systematically.
This article presents Crypto Technical Intelligence, a Python-based trading analysis framework designed to evaluate Bitcoin and Ethereum using the MarketFlow All-in-One Market Finance API through RapidAPI. The system retrieves five categories of technical information: SMA, EMA, RSI, MACD, and Bollinger Bands (BBANDS). It also dynamically discovers available indicators through the API before conducting multi-asset analysis.
The analytical framework consists of five main processing stages, including API configuration, indicator discovery, data validation, multi-asset indicator retrieval, and final trading intelligence generation. The system also incorporates a specialized MACD extraction mechanism to accommodate different API response structures, including tabular records and nested arrays.
The final analytical engine combines RSI conditions, SMA and EMA relationships, and MACD momentum into a bullish scoring mechanism. Based on the resulting score, each cryptocurrency receives a market classification of BULLISH, BEARISH, or NEUTRAL. The system additionally generates technical charts, data quality reports, processing summaries, and downloadable CSV datasets.
The primary objective of this implementation is to demonstrate how Python and financial APIs can be integrated into a systematic cryptocurrency analysis framework. By combining multiple technical indicators and automated data processing, Crypto Technical Intelligence provides a structured foundation for monitoring BTC and ETH market conditions and supporting data-driven trading decisions.
2. Methodology
The Crypto Technical Intelligence framework is organized into five computational cells. Each cell performs a specific function within the overall analytical workflow.
Cell | Main function |
|---|---|
Cell 1 | Library imports, RapidAPI configuration, trading parameters, and visualization settings. |
Cell 2 | API connection, indicator discovery, and BTC SMA connectivity testing. |
Cell 3 | JSON extraction, data normalization, and API response validation. |
Cell 4 | Multi-indicator retrieval for BTC and ETH. |
Cell 5 | Indicator integration, technical scoring, market classification, visualization, and CSV export. |
2.1. API Configuration and Cryptocurrency Selection
The system uses the MarketFlow All-in-One Market Finance API as its primary data provider.
Authentication is managed through a RapidAPI key, which is entered interactively using Python's getpass module.
Two API endpoints are configured:
/tools/indicator/listfor retrieving the available technical indicator list./tools/indicatorfor retrieving individual technical indicator data.
The analysis focuses on two cryptocurrency assets:
Bitcoin (BTC).
Ethereum (ETH).
The requested indicator parameters include:
Parameter | Value |
|---|---|
K Period | 14 |
Span B Period | 52 |
Displacement | 26 |
Signal Period | 9 |
Standard Deviation | 2 |
D Period | 3 |
Base Period | 26 |
Fast Period | 12 |
Slow Period | 26 |
Conversion Period | 9 |
General Period | 14 |
The indicator candidates are SMA, EMA, RSI, MACD, and BBANDS. The parameters are supplied to the API as configured in the original implementation; the exact parameter used by each indicator depends on the API's own interpretation.
2.2. API Connection and Indicator Discovery
The second stage establishes communication with the MarketFlow API through an authenticated GET request.
A reusable marketflow_request() function handles HTTP communication, applies connection and response timeouts, checks the HTTP response status, and returns JSON data.
The system first requests the official indicator list. It then performs a separate SMA request for BTC to verify whether the indicator endpoint can return usable data.
This initial test provides two connectivity checks:
Availability of the indicator discovery endpoint.
Availability of the technical indicator endpoint.
The BTC SMA response is subsequently reused during the multi-asset analysis to avoid making the same request twice.
2.3. Data Processing and Validation
The third stage converts API responses into standardized Pandas DataFrames.
The extract_records() function recursively searches nested JSON structures for lists of dictionary records. When a suitable record collection is identified, it is converted into a normalized table.
The clean_dataframe() function standardizes column names by removing unsupported characters and converting them into lowercase format.
Object-type columns are also examined to determine whether they contain numeric values. Columns with more than 70% successfully convertible numeric observations are converted into numeric data types.
The system then generates a validation report containing the available indicator structure, BTC SMA response structure, row counts, and detected columns.
This process provides an initial assessment of whether the API responses can be processed by the subsequent analytical stages.
2.4. Multi-Asset Indicator Retrieval
The fourth stage retrieves the selected indicators for BTC and ETH.
Each asset is processed independently, and the system requests SMA, EMA, RSI, MACD, and BBANDS through the indicator endpoint.
The BTC SMA result from the previous cell is reused, while the remaining indicator requests are executed individually.
Each request is recorded as SUCCESS or FAILED. A one-second delay is also applied between requests to reduce the frequency of consecutive API calls.
The resulting request summary provides an overview of indicator availability across both cryptocurrency assets.
2.5. Indicator Integration and Technical Scoring
The fifth stage integrates the retrieved indicator datasets into unified BTC and ETH analytical tables.
SMA, EMA, and RSI are extracted from the API's data.values structure. MACD is processed through a dedicated parser that identifies the MACD line, signal line, and histogram across different response formats.
The resulting indicator series are aligned by observation position. The implementation assumes that the final observations from different indicators correspond approximately to the same latest market observation.
The technical scoring engine evaluates three components:
RSI momentum.
SMA and EMA relationships.
MACD momentum.
Bullish and bearish confirmations are counted separately.
The bullish score is calculated using:
\[ Bullish\ Score = \frac{Bullish\ Points} {Bullish\ Points+Bearish\ Points} \times100 \]
The final market classification follows these thresholds:
Bullish score | Market bias |
|---|---|
65% or higher | BULLISH |
35% or lower | BEARISH |
Between 35% and 65% | NEUTRAL |
No valid directional points | INSUFFICIENT DATA |
RSI readings of 70 or higher are classified as OVERBOUGHT, while readings of 30 or lower are classified as OVERSOLD. These extreme conditions are reported separately and do not contribute bullish or bearish points in the final scoring implementation.
2.6. Technical Visualization and Data Export
The final stage generates three technical visualization panels for each cryptocurrency:
Moving Average Chart: SMA and EMA.
RSI Chart: RSI with reference levels at 30, 50, and 70.
MACD Chart: MACD line, signal line, and histogram.
The system also exports six analytical CSV files, including individual BTC and ETH indicator datasets, trading signals, data quality reports, processing status, and API metadata.
These outputs provide a basis for further financial research, historical comparisons, and additional quantitative analysis.
3. Implementation and Python Code
The following implementation is based on the uploaded crypto_technical_intelligence.py source. The code is organized into five cells, following the original workflow.
The final Cell 5 uses the more comprehensive MACD extraction and validation implementation included in the uploaded file. The duplicated earlier Cell 2 and preliminary Cell 5 implementation have been consolidated to avoid unnecessary repetition.
Cell 1 — Setup and API Configuration
The first cell imports the required Python libraries and establishes the MarketFlow API configuration.
The system defines BTC and ETH as the primary assets and configures the technical indicator parameters. It also initializes the five indicator candidates and establishes a dark visualization theme for the analytical dashboard.
Code — Cell 1
# ==========================================================
# CELL 2 - API CONNECTION & INDICATOR DISCOVERY
# ==========================================================

def marketflow_request(endpoint, params=None):

    url = BASE_URL + endpoint

    response = requests.get(
        url,
        headers=HEADERS,
        params=params,
        timeout=(15, 60)
    )

    response.raise_for_status()

    return response.json()


# ----------------------------------------------------------
# FETCH AVAILABLE INDICATORS
# ----------------------------------------------------------

print("Connecting to MarketFlow...")

try:

    indicator_list_raw = marketflow_request(
        ENDPOINTS["INDICATOR_LIST"]
    )

    print("\nINDICATOR LIST: SUCCESS")

    print(json.dumps(
        indicator_list_raw,
        indent=2
    )[:5000])

except Exception as e:

    indicator_list_raw = None

    print("\nINDICATOR LIST FAILED:")
    print(repr(e))


# ----------------------------------------------------------
# TEST SMA BTC
# ----------------------------------------------------------

print("\nTesting BTC SMA...")

try:

    test_params = {
        **INDICATOR_PARAMS,
        "indicator": "SMA",
        "symbol": "BTC"
    }

    btc_test_raw = marketflow_request(
        ENDPOINTS["INDICATOR"],
        test_params
    )

    print("BTC SMA: SUCCESS")

    print(json.dumps(
        btc_test_raw,
        indent=2
    )[:3000])

except Exception as e:

    btc_test_raw = None

    print("BTC SMA FAILED:")
    print(repr(e))


# ----------------------------------------------------------
# CONNECTION REPORT
# ----------------------------------------------------------

print("\n" + "=" * 60)

print(
    "INDICATOR LIST:",
    "AVAILABLE" if indicator_list_raw is not None
    else "UNAVAILABLE"
)

print(
    "BTC SMA:",
    "AVAILABLE" if btc_test_raw is not None
    else "UNAVAILABLE"
)

print("=" * 60)
Cell 2 — API Connection and Indicator Discovery
The second cell establishes the connection with the MarketFlow API and retrieves the available technical indicator list.
The system also performs a preliminary SMA request for BTC to validate the indicator endpoint.
The returned JSON responses are displayed for structural inspection. This is important because the API may return indicator data using different nested structures.
The BTC SMA response is stored for reuse in Cell 4, reducing unnecessary API requests.
Code — Cell 2
# ==========================================================
# CELL 2 - API CONNECTION & INDICATOR DISCOVERY
# ==========================================================

def marketflow_request(endpoint, params=None):

    url = BASE_URL + endpoint

    response = requests.get(
        url,
        headers=HEADERS,
        params=params,
        timeout=(15, 60)
    )

    response.raise_for_status()

    return response.json()


# ----------------------------------------------------------
# FETCH AVAILABLE INDICATORS
# ----------------------------------------------------------

print("Connecting to MarketFlow...")

try:

    indicator_list_raw = marketflow_request(
        ENDPOINTS["INDICATOR_LIST"]
    )

    print("\nINDICATOR LIST: SUCCESS")

    print(json.dumps(
        indicator_list_raw,
        indent=2
    )[:5000])

except Exception as e:

    indicator_list_raw = None

    print("\nINDICATOR LIST FAILED:")
    print(repr(e))


# ----------------------------------------------------------
# TEST SMA BTC
# ----------------------------------------------------------

print("\nTesting BTC SMA...")

try:

    test_params = {
        **INDICATOR_PARAMS,
        "indicator": "SMA",
        "symbol": "BTC"
    }

    btc_test_raw = marketflow_request(
        ENDPOINTS["INDICATOR"],
        test_params
    )

    print("BTC SMA: SUCCESS")

    print(json.dumps(
        btc_test_raw,
        indent=2
    )[:3000])

except Exception as e:

    btc_test_raw = None

    print("BTC SMA FAILED:")
    print(repr(e))


# ----------------------------------------------------------
# CONNECTION REPORT
# ----------------------------------------------------------

print("\n" + "=" * 60)

print(
    "INDICATOR LIST:",
    "AVAILABLE" if indicator_list_raw is not None
    else "UNAVAILABLE"
)

print(
    "BTC SMA:",
    "AVAILABLE" if btc_test_raw is not None
    else "UNAVAILABLE"
)

print("=" * 60)
Cell 3 — Data Processing and Indicator Validation
The third cell implements the JSON extraction and data-cleaning functions.
The extract_records() function recursively searches the API response for structured records and converts the available data into a Pandas DataFrame.
The clean_dataframe() function standardizes column names and attempts to convert numeric-looking columns into appropriate numeric data types.
The processed indicator list and BTC SMA response are then examined to generate a data validation report.
The final API status is determined based on whether at least one of the two API requests returned a response.
Code — Cell 3
# ==========================================================
# CELL 3 - DATA PROCESSING & VALIDATION
# ==========================================================

def extract_records(data):

    if data is None:
        return pd.DataFrame()

    if isinstance(data, list):

        if data and all(isinstance(x, dict) for x in data):
            return pd.json_normalize(data)

        return pd.DataFrame({"value": data})

    if isinstance(data, dict):

        candidates = []

        def scan(obj):

            if isinstance(obj, list):

                if obj and all(
                    isinstance(x, dict) for x in obj
                ):
                    candidates.append(obj)

                for item in obj:
                    scan(item)

            elif isinstance(obj, dict):

                for value in obj.values():
                    scan(value)

        scan(data)

        if candidates:

            return pd.json_normalize(
                max(candidates, key=len),
                sep="_"
            )

        return pd.json_normalize(data, sep="_")

    return pd.DataFrame()


def clean_dataframe(df):

    if df.empty:
        return df

    df = df.copy()

    df.columns = [
        re.sub(
            r"[^a-zA-Z0-9_]",
            "",
            str(c)
        ).lower()
        for c in df.columns
    ]

    for col in df.columns:

        if df[col].dtype == "object":

            converted = pd.to_numeric(
                df[col].astype(str)
                .str.replace(",", "", regex=False),
                errors="coerce"
            )

            if converted.notna().mean() > 0.7:
                df[col] = converted

    return df


# ----------------------------------------------------------
# PROCESS INDICATOR LIST
# ----------------------------------------------------------

indicator_list_df = clean_dataframe(
    extract_records(indicator_list_raw)
)

btc_test_df = clean_dataframe(
    extract_records(btc_test_raw)
)

print("=" * 60)
print("             DATA VALIDATION REPORT")
print("=" * 60)

print("\nAVAILABLE INDICATORS STRUCTURE:")

if not indicator_list_df.empty:

    print(indicator_list_df.columns.tolist())
    display(indicator_list_df.head(20))

else:

    print("Indicator list belum memiliki struktur tabel.")

print("\nBTC SMA RESPONSE STRUCTURE:")

if not btc_test_df.empty:

    print("Rows:", len(btc_test_df))
    print("Columns:", btc_test_df.columns.tolist())

    display(btc_test_df.head(10))

else:

    print("BTC SMA belum menghasilkan data tabel.")


# ----------------------------------------------------------
# VALIDATE API AVAILABILITY
# ----------------------------------------------------------

api_available = (
    indicator_list_raw is not None
    or btc_test_raw is not None
)

print("\nAPI STATUS:",
      "CONNECTED" if api_available else "UNAVAILABLE")

print("=" * 60)
Cell 4 — BTC and ETH Multi-Indicator Analysis
The fourth cell retrieves the five selected technical indicators for Bitcoin and Ethereum.
Each asset is analyzed independently, and each indicator request is recorded in the indicator_status dataset.
The system reuses the BTC SMA response generated in Cell 2. Other requests are executed through the reusable API request function.
Successful and failed requests are stored separately, allowing the analyst to identify which indicators are available for each cryptocurrency.
The request summary also calculates the overall success rate.
Code — Cell 4
# ==========================================================
# CELL 4 - MULTI ASSET INDICATOR ENGINE
# ==========================================================

indicator_results = {}
indicator_status = []

if not api_available:

    print("API unavailable. Jalankan ulang Cell 2.")

else:

    for symbol in ASSETS:

        indicator_results[symbol] = {}

        print("\n" + "=" * 60)
        print(f"ANALYZING {symbol}")
        print("=" * 60)

        for indicator in INDICATOR_CANDIDATES:

            print(f"\nRequesting {symbol} - {indicator}")

            params = {
                **INDICATOR_PARAMS,
                "indicator": indicator,
                "symbol": symbol
            }

            try:

                # Reuse the BTC SMA test from Cell 2
                if (
                    symbol == "BTC"
                    and indicator == "SMA"
                    and btc_test_raw is not None
                ):

                    result = btc_test_raw

                else:

                    result = marketflow_request(
                        ENDPOINTS["INDICATOR"],
                        params
                    )

                indicator_results[symbol][indicator] = result

                indicator_status.append({
                    "Asset": symbol,
                    "Indicator": indicator,
                    "Status": "SUCCESS"
                })

                print("SUCCESS")

            except Exception as e:

                indicator_results[symbol][indicator] = None

                indicator_status.append({
                    "Asset": symbol,
                    "Indicator": indicator,
                    "Status": "FAILED"
                })

                print("FAILED:", str(e)[:200])

            time.sleep(1)


# ----------------------------------------------------------
# REQUEST SUMMARY
# ----------------------------------------------------------

indicator_status_df = pd.DataFrame(
    indicator_status
)

print("\n" + "=" * 60)
print("INDICATOR REQUEST SUMMARY")
print("=" * 60)

display(indicator_status_df)

if not indicator_status_df.empty:

    print("\nSUCCESS RATE:")

    success_rate = (
        indicator_status_df["Status"].eq("SUCCESS").mean()
        * 100
    )

    print(f"{success_rate:.2f}%")
Cell 5 — Final Trading Intelligence and Market Verdict
The fifth cell integrates the retrieved indicators into a unified analytical framework.
This cell contains a specialized MACD parser to handle API responses containing nested dictionaries, lists of records, or separate arrays for MACD, signal, and histogram values.
SMA, EMA, and RSI are extracted from their standard data.values structures.
The resulting observations are aligned by their ending positions. This approach assumes that the indicator series represent approximately synchronized observations, which should be verified against the API metadata.
The technical signal engine then evaluates RSI, moving average relationships, and MACD momentum to calculate the bullish score and generate the final market bias.
The final dashboard includes:
Data quality report.
Indicator processing status.
Unified BTC and ETH datasets.
Final trading intelligence.
Technical charts.
CSV export.
Code — Cell 5
# ==========================================================
# CELL 5 - FINAL INTEGRATED CRYPTO TRADING INTELLIGENCE
# BTC & ETH | SMA | EMA | RSI | MACD
# ==========================================================

import pandas as pd
import numpy as np
import matplotlib.pyplot as plt
import re
import json

from IPython.display import display, Markdown

# ==========================================================
# 1. UNIVERSAL MACD DATA EXTRACTOR
# ==========================================================

def normalize_key(key):

    return re.sub(
        r"[^a-z0-9]",
        "",
        str(key).lower()
    )


def find_macd_records(obj):

    if isinstance(obj, pd.DataFrame):
        return obj.copy()

    if isinstance(obj, list):

        if obj and all(isinstance(x, dict) for x in obj):

            keys = [
                normalize_key(k)
                for k in obj[0].keys()
            ]

            has_macd = any(
                "macd" in k or "histogram" in k
                for k in keys
            )

            if has_macd:
                return pd.DataFrame(obj)

        for item in obj:

            result = find_macd_records(item)

            if result is not None:
                return result

    elif isinstance(obj, dict):

        normalized = {
            normalize_key(k): v
            for k, v in obj.items()
        }

        # Detect dictionary containing arrays
        macd_key = next(
            (
                k for k in normalized
                if "macd" in k
                and "signal" not in k
                and "histogram" not in k
            ),
            None
        )

        signal_key = next(
            (
                k for k in normalized
                if "signal" in k
            ),
            None
        )

        histogram_key = next(
            (
                k for k in normalized
                if "histogram" in k
            ),
            None
        )

        if macd_key and signal_key:

            result = {
                "MACD": normalized[macd_key],
                "MACD_SIGNAL": normalized[signal_key]
            }

            if histogram_key:

                result["MACD_HISTOGRAM"] = (
                    normalized[histogram_key]
                )

            if all(
                isinstance(v, (list, tuple, np.ndarray))
                for v in result.values()
            ):

                lengths = [
                    len(v) for v in result.values()
                ]

                if len(set(lengths)) == 1:

                    return pd.DataFrame(result)

        # Search nested dictionaries
        for value in obj.values():

            result = find_macd_records(value)

            if result is not None:
                return result

    return None


# ==========================================================
# 2. SMA / EMA / RSI EXTRACTOR
# ==========================================================

def extract_standard_indicator(raw, indicator):

    if raw is None:
        return pd.Series(dtype=float)

    if not isinstance(raw, dict):
        return pd.Series(dtype=float)

    data = raw.get("data", {})

    if not isinstance(data, dict):
        return pd.Series(dtype=float)

    values = data.get("values")

    if values is None:
        return pd.Series(dtype=float)

    return pd.to_numeric(
        pd.Series(values),
        errors="coerce"
    )


# ==========================================================
# 3. NORMALIZE MACD COLUMNS
# ==========================================================

def normalize_macd(raw):

    df = find_macd_records(raw)

    if df is None or df.empty:
        return pd.DataFrame()

    rename = {}

    for col in df.columns:

        key = normalize_key(col)

        if "histogram" in key:
            rename[col] = "MACD_HISTOGRAM"

        elif "signal" in key:
            rename[col] = "MACD_SIGNAL"

        elif "macd" in key:
            rename[col] = "MACD"

    df = df.rename(columns=rename)

    required = [
        "MACD",
        "MACD_SIGNAL",
        "MACD_HISTOGRAM"
    ]

    available = [
        col for col in required
        if col in df.columns
    ]

    if not {"MACD", "MACD_SIGNAL"}.issubset(available):

        return pd.DataFrame()

    df = df[available].apply(
        pd.to_numeric,
        errors="coerce"
    )

    df = df.reset_index(drop=True)

    # Calculate histogram only if not supplied by API
    if "MACD_HISTOGRAM" not in df.columns:

        df["MACD_HISTOGRAM"] = (
            df["MACD"] - df["MACD_SIGNAL"]
        )

    return df


# ==========================================================
# 4. BUILD UNIFIED BTC & ETH DATA
# ==========================================================

unified_data = {}
metadata_records = []
processing_report = []

INDICATORS = ["SMA", "EMA", "RSI", "MACD"]

for symbol in ASSETS:

    print("\n" + "=" * 65)
    print(f"PROCESSING {symbol}")
    print("=" * 65)

    raw_indicators = indicator_results.get(
        symbol, {}
    )

    series_dict = {}

    # ----------------------------------------------
    # SMA / EMA / RSI
    # ----------------------------------------------

    for indicator in ["SMA", "EMA", "RSI"]:

        raw = raw_indicators.get(indicator)

        series = extract_standard_indicator(
            raw,
            indicator
        )

        if not series.empty:

            series_dict[indicator] = series

            processing_report.append({

                "Asset": symbol,
                "Indicator": indicator,
                "Status": "SUCCESS",
                "Observations": len(series),
                "Valid Values": series.notna().sum()

            })

        else:

            processing_report.append({

                "Asset": symbol,
                "Indicator": indicator,
                "Status": "UNAVAILABLE",
                "Observations": 0,
                "Valid Values": 0

            })

        # Metadata
        if isinstance(raw, dict):

            metadata_records.append({

                "Asset": symbol,
                "Indicator": indicator,
                "Timeframe": raw.get("timeframe"),
                "Timestamp": raw.get("timestamp"),
                "Period": raw.get(
                    "data", {}
                ).get(
                    "metadata", {}
                ).get(
                    "period"
                )

            })

    # ----------------------------------------------
    # MACD
    # ----------------------------------------------

    macd_raw = raw_indicators.get("MACD")

    macd_df = normalize_macd(macd_raw)

    if not macd_df.empty:

        for col in macd_df.columns:

            series_dict[col] = macd_df[col]

        processing_report.append({

            "Asset": symbol,
            "Indicator": "MACD",
            "Status": "SUCCESS",
            "Observations": len(macd_df),
            "Valid Values": macd_df["MACD"].notna().sum()

        })

    else:

        processing_report.append({

            "Asset": symbol,
            "Indicator": "MACD",
            "Status": "FAILED",
            "Observations": 0,
            "Valid Values": 0

        })

        print("WARNING: MACD data unavailable.")

    # ----------------------------------------------
    # ALIGN OBSERVATIONS
    # ----------------------------------------------

    if series_dict:

        max_length = max(
            len(series)
            for series in series_dict.values()
        )

        aligned = {}

        for name, series in series_dict.items():

            series = series.reset_index(drop=True)

            # Right-align: assumes all series end at
            # approximately the same latest observation.
            series.index = range(
                max_length - len(series),
                max_length
            )

            aligned[name] = series

        df = pd.DataFrame(aligned)

        df.index.name = "Observation"

        unified_data[symbol] = df

    else:

        unified_data[symbol] = pd.DataFrame()


# ==========================================================
# 5. DATA QUALITY REPORT
# ==========================================================

display(
    Markdown("# 1. DATA QUALITY REPORT")
)

quality_records = []

for symbol, df in unified_data.items():

    for col in df.columns:

        valid = df[col].dropna()

        quality_records.append({

            "Asset": symbol,

            "Indicator": col,

            "Observations": len(df),

            "Valid Values": len(valid),

            "Missing Values": df[col].isna().sum(),

            "Latest Value": (
                valid.iloc[-1]
                if not valid.empty
                else np.nan
            )

        })


quality_df = pd.DataFrame(
    quality_records
)

if not quality_df.empty:

    display(
        quality_df.round(6)
    )


# ==========================================================
# 6. PROCESSING STATUS
# ==========================================================

display(
    Markdown("# 2. INDICATOR PROCESSING STATUS")
)

processing_df = pd.DataFrame(
    processing_report
)

display(processing_df)


# ==========================================================
# 7. UNIFIED DATA TABLE
# ==========================================================

display(
    Markdown("# 3. UNIFIED BTC & ETH DATA")
)

for symbol, df in unified_data.items():

    print("\n" + "=" * 65)
    print(f"{symbol} TECHNICAL DATA")
    print("=" * 65)

    if df.empty:

        print("No data available.")
        continue

    print("Total observations:", len(df))

    print("Available columns:", df.columns.tolist())

    display(
        df.tail(15).round(6)
    )


# ==========================================================
# 8. TECHNICAL SIGNAL ENGINE
# ==========================================================

signal_records = []


def get_last_valid(df, columns):

    if not set(columns).issubset(df.columns):
        return None

    return df[columns].dropna()


for symbol, df in unified_data.items():

    if df.empty:
        continue

    bullish = 0
    bearish = 0

    # ----------------------------------------------
    # RSI
    # ----------------------------------------------

    rsi_data = (
        df["RSI"].dropna()
        if "RSI" in df.columns
        else pd.Series(dtype=float)
    )

    rsi = (
        rsi_data.iloc[-1]
        if not rsi_data.empty
        else np.nan
    )

    rsi_signal = "UNAVAILABLE"

    if pd.notna(rsi):

        if rsi >= 70:

            rsi_signal = "OVERBOUGHT"

        elif rsi <= 30:

            rsi_signal = "OVERSOLD"

        elif rsi > 50:

            rsi_signal = "BULLISH"

            bullish += 1

        else:

            rsi_signal = "BEARISH"

            bearish += 1

    # ----------------------------------------------
    # SMA / EMA
    # ----------------------------------------------

    ma_signal = "UNAVAILABLE"

    ma_data = get_last_valid(
        df,
        ["SMA", "EMA"]
    )

    if ma_data is not None and len(ma_data) >= 1:

        latest_ma = ma_data.iloc[-1]

        if latest_ma["SMA"] > latest_ma["EMA"]:

            ma_signal = "SMA ABOVE EMA"

            bullish += 1

        elif latest_ma["SMA"] < latest_ma["EMA"]:

            ma_signal = "SMA BELOW EMA"

            bearish += 1

        else:

            ma_signal = "SMA EQUAL EMA"

    # ----------------------------------------------
    # MACD
    # ----------------------------------------------

    macd_signal = "UNAVAILABLE"

    macd_data = get_last_valid(
        df,
        ["MACD", "MACD_SIGNAL"]
    )

    macd_histogram = np.nan

    if macd_data is not None and len(macd_data) >= 1:

        latest_macd = macd_data.iloc[-1]

        macd_value = latest_macd["MACD"]

        macd_signal_value = latest_macd["MACD_SIGNAL"]

        if macd_value > macd_signal_value:

            macd_signal = "BULLISH"

            bullish += 1

        elif macd_value < macd_signal_value:

            macd_signal = "BEARISH"

            bearish += 1

        else:

            macd_signal = "NEUTRAL"

        if "MACD_HISTOGRAM" in df.columns:

            histogram_data = df[
                "MACD_HISTOGRAM"
            ].dropna()

            if not histogram_data.empty:

                macd_histogram = histogram_data.iloc[-1]

    # ----------------------------------------------
    # MACD CROSSOVER
    # ----------------------------------------------

    macd_crossover = "UNAVAILABLE"

    if macd_data is not None and len(macd_data) >= 2:

        previous = macd_data.iloc[-2]

        current = macd_data.iloc[-1]

        if (
            previous["MACD"] <= previous["MACD_SIGNAL"]
            and current["MACD"] > current["MACD_SIGNAL"]
        ):

            macd_crossover = "BULLISH CROSSOVER"

        elif (
            previous["MACD"] >= previous["MACD_SIGNAL"]
            and current["MACD"] < current["MACD_SIGNAL"]
        ):

            macd_crossover = "BEARISH CROSSOVER"

        else:

            macd_crossover = "NO NEW CROSSOVER"

    # ----------------------------------------------
    # BULLISH SCORE
    # ----------------------------------------------

    total = bullish + bearish

    score = (
        bullish / total * 100
        if total > 0
        else np.nan
    )

    if total == 0:

        bias = "INSUFFICIENT DATA"

    elif score >= 65:

        bias = "BULLISH"

    elif score <= 35:

        bias = "BEARISH"

    else:

        bias = "NEUTRAL"

    # ----------------------------------------------
    # RECORD
    # ----------------------------------------------

    signal_records.append({

        "Asset": symbol,

        "SMA": (
            df["SMA"].dropna().iloc[-1]
            if "SMA" in df.columns
            and df["SMA"].notna().any()
            else np.nan
        ),

        "EMA": (
            df["EMA"].dropna().iloc[-1]
            if "EMA" in df.columns
            and df["EMA"].notna().any()
            else np.nan
        ),

        "RSI": rsi,

        "RSI Signal": rsi_signal,

        "MA Signal": ma_signal,

        "MACD": (
            macd_value
            if macd_data is not None and len(macd_data)
            else np.nan
        ),

        "MACD Signal Value": (
            macd_signal_value
            if macd_data is not None and len(macd_data)
            else np.nan
        ),

        "MACD Histogram": macd_histogram,

        "MACD Interpretation": macd_signal,

        "MACD Crossover": macd_crossover,

        "Bullish Points": bullish,

        "Bearish Points": bearish,

        "Bullish Score (%)": score,

        "Market Bias": bias

    })


signals_df = pd.DataFrame(
    signal_records
)


# ==========================================================
# 9. FINAL TRADING INTELLIGENCE
# ==========================================================

display(
    Markdown("# 4. FINAL TRADING INTELLIGENCE")
)

if not signals_df.empty:

    display(
        signals_df.round(6)
    )

else:

    print("Insufficient data for trading analysis.")


# ==========================================================
# 10. BTC & ETH TECHNICAL CHARTS
# ==========================================================

display(
    Markdown("# 5. TECHNICAL CHARTS")
)

for symbol, df in unified_data.items():

    if df.empty:
        continue

    fig, axes = plt.subplots(
        3,
        1,
        figsize=(15, 11)
    )

    # ----------------------------------------------
    # MOVING AVERAGES
    # ----------------------------------------------

    for col in ["SMA", "EMA"]:

        if col in df.columns:

            axes[0].plot(
                df.index,
                df[col],
                label=col
            )

    axes[0].set_title(
        f"{symbol} - MOVING AVERAGE"
    )

    axes[0].legend()

    axes[0].grid(alpha=0.2)

    # ----------------------------------------------
    # RSI
    # ----------------------------------------------

    if "RSI" in df.columns:

        axes[1].plot(
            df.index,
            df["RSI"],
            label="RSI"
        )

        axes[1].axhline(
            70,
            linestyle="--",
            label="Overbought"
        )

        axes[1].axhline(
            50,
            linestyle=":",
            label="Midline"
        )

        axes[1].axhline(
            30,
            linestyle="--",
            label="Oversold"
        )

        axes[1].set_ylim(0, 100)

    axes[1].set_title(
        f"{symbol} - RSI"
    )

    axes[1].legend()

    axes[1].grid(alpha=0.2)

    # ----------------------------------------------
    # MACD
    # ----------------------------------------------

    for col in ["MACD", "MACD_SIGNAL"]:

        if col in df.columns:

            axes[2].plot(
                df.index,
                df[col],
                label=col
            )

    if "MACD_HISTOGRAM" in df.columns:

        histogram = df["MACD_HISTOGRAM"]

        axes[2].bar(
            df.index,
            histogram,
            label="Histogram",
            alpha=0.35
        )

    axes[2].axhline(
        0,
        linestyle="--"
    )

    axes[2].set_title(
        f"{symbol} - MACD"
    )

    axes[2].legend()

    axes[2].grid(alpha=0.2)

    plt.tight_layout()

    plt.show()


# ==========================================================
# 11. EXPORT CSV
# ==========================================================

for symbol, df in unified_data.items():

    if not df.empty:

        df.to_csv(
            f"{symbol}_technical_data.csv"
        )


signals_df.to_csv(
    "crypto_trading_signals.csv",
    index=False
)

quality_df.to_csv(
    "crypto_data_quality.csv",
    index=False
)

processing_df.to_csv(
    "crypto_processing_status.csv",
    index=False
)

metadata_df = pd.DataFrame(
    metadata_records
)

metadata_df.to_csv(
    "crypto_api_metadata.csv",
    index=False
)


# ==========================================================
# 12. FINAL VALIDATION
# ==========================================================

print("\n" + "=" * 70)
print("       CRYPTO TECHNICAL INTELLIGENCE COMPLETED")
print("=" * 70)

for symbol, df in unified_data.items():

    print(f"\n{symbol}")

    print("Observations:", len(df))

    print("Columns:", df.columns.tolist())

    for col in [
        "SMA",
        "EMA",
        "RSI",
        "MACD",
        "MACD_SIGNAL",
        "MACD_HISTOGRAM"
    ]:

        if col in df.columns:

            print(
                f"{col}: "
                f"{df[col].notna().sum()} valid values"
            )

        else:

            print(f"{col}: NOT AVAILABLE")


print("\nEXPORTED FILES:")

print("1. BTC_technical_data.csv")
print("2. ETH_technical_data.csv")
print("3. crypto_trading_signals.csv")
print("4. crypto_data_quality.csv")
print("5. crypto_processing_status.csv")
print("6. crypto_api_metadata.csv")

print("\nANALYSIS FINISHED")
print("=" * 70)
Result:
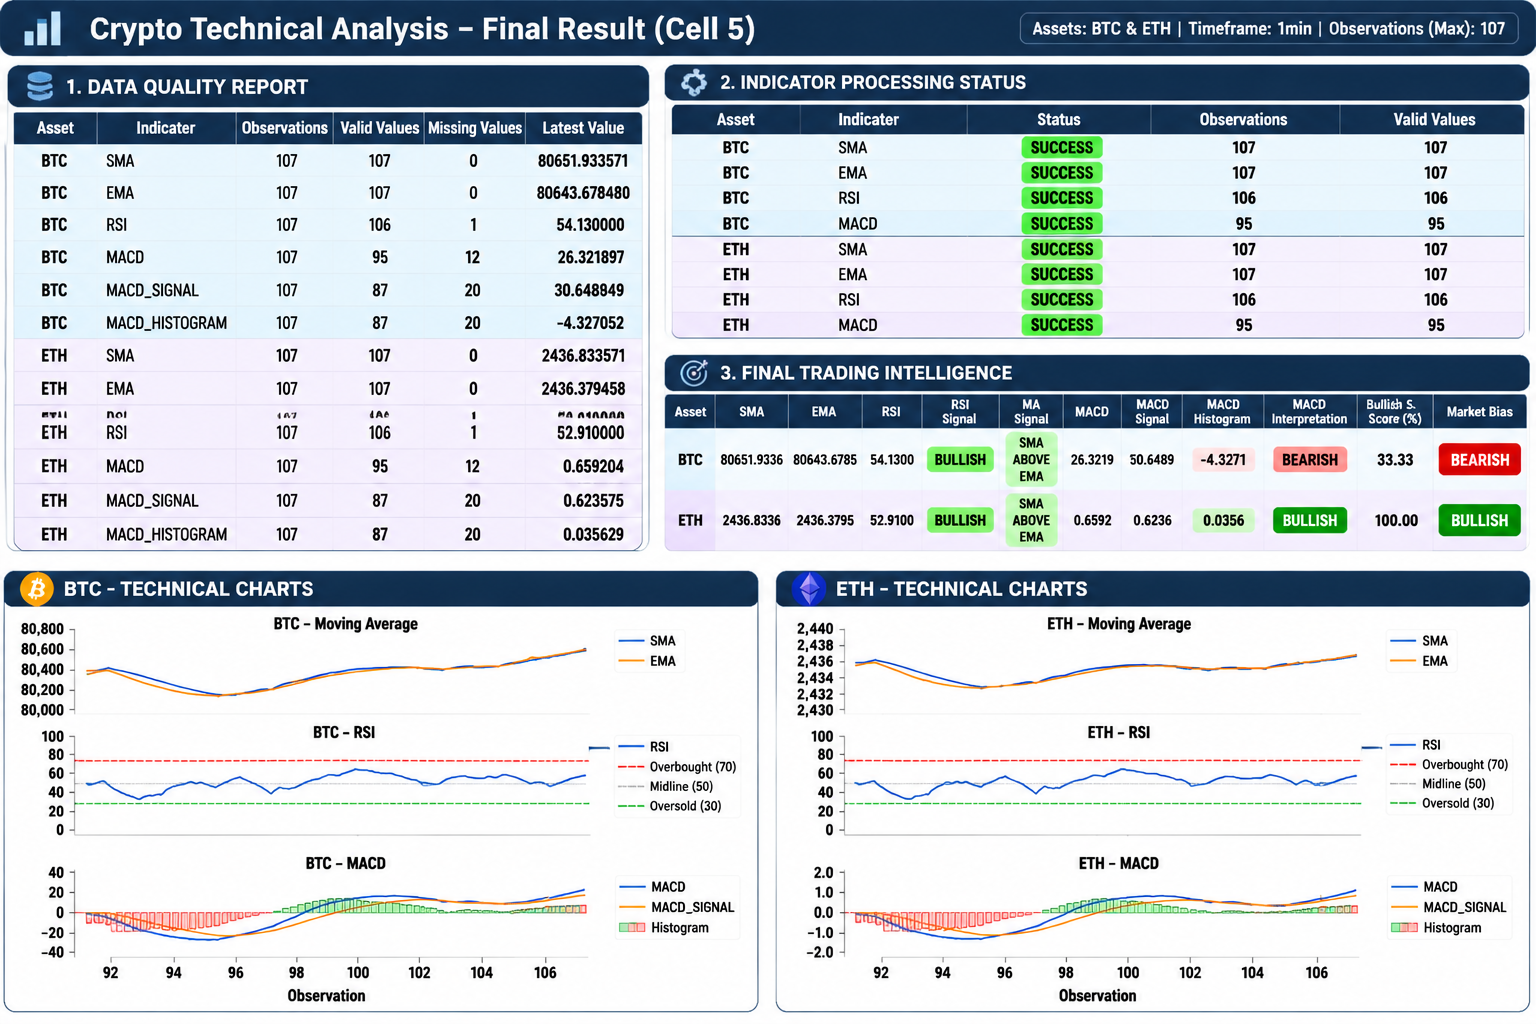
4. Results and Discussion
4.1. API Connectivity and Indicator Availability
The initial API connection stage establishes communication with the MarketFlow financial data service and retrieves the available indicator information.
The system performs two preliminary requests: retrieving the indicator list and testing the BTC SMA endpoint.
These requests provide an initial assessment of API connectivity before the full multi-asset analysis begins.
The connection report distinguishes between available and unavailable endpoints, allowing potential API communication problems to be identified before proceeding.
The successful retrieval of the indicator list does not automatically guarantee that every individual indicator is supported or accessible. Each indicator must therefore be validated through its own request.
4.2. BTC and ETH Multi-Indicator Data Retrieval
The multi-asset analysis module retrieves SMA, EMA, RSI, MACD, and BBANDS information for Bitcoin and Ethereum.
Each request is recorded independently, making it possible to identify differences in indicator availability between the two assets.
The request status table provides information about successful and failed API requests, while the success rate summarizes the overall retrieval performance.
This approach is useful for identifying incomplete datasets before generating the final trading intelligence report.
4.3. Data Quality and Indicator Normalization
One of the important components of the framework is its ability to process different API response structures.
The system uses separate extraction functions for standard indicators and MACD.
SMA, EMA, and RSI are retrieved from the data.values structure, whereas MACD requires additional processing because its response may contain multiple related values.
The specialized MACD parser identifies three components:
MACD line.
MACD signal line.
MACD histogram.
When the API provides MACD and signal values but does not provide a histogram, the system calculates the histogram using:
\[ MACD\ Histogram = MACD - MACD\ Signal \]
The data quality report then evaluates the number of observations, valid values, missing values, and latest available values for each indicator.
This provides an overview of data completeness before technical signal generation.
4.4. Moving Average Trend Evaluation
The moving average component compares SMA and EMA values to identify their relative positioning.
When SMA is greater than EMA, the system records a bullish moving average condition. Conversely, when SMA is lower than EMA, the system records a bearish condition.
This comparison provides a simplified assessment of the relationship between two moving average indicators.
The system also visualizes SMA and EMA values independently for BTC and ETH, allowing analysts to examine their historical movements and relative positioning.
It is important to note that this implementation compares the latest available SMA and EMA values rather than calculating a complete historical moving average crossover strategy.
4.5. RSI Momentum Analysis
The RSI component evaluates momentum conditions using the following thresholds:
RSI value | Interpretation |
|---|---|
70 or higher | OVERBOUGHT |
Above 50 and below 70 | BULLISH |
Above 30 and 50 or lower | BEARISH |
30 or lower | OVERSOLD |
Bullish and bearish RSI readings contribute to the final scoring mechanism.
Overbought and oversold conditions are reported separately and do not directly contribute directional points.
The RSI visualization includes reference levels at 30, 50, and 70, providing a consistent framework for examining momentum conditions across both cryptocurrencies.
4.6. MACD Momentum and Crossover Detection
The MACD component evaluates the relationship between the MACD line and its signal line.
A MACD value above the signal line is classified as bullish momentum, while a MACD value below the signal line is classified as bearish momentum.
The system also identifies potential crossover conditions by comparing the latest two valid MACD observations.
A bullish crossover occurs when the MACD line moves from below or equal to the signal line to above it.
Conversely, a bearish crossover occurs when the MACD line moves from above or equal to the signal line to below it.
The MACD histogram provides additional information about the difference between the MACD line and signal line.
These measurements allow the system to present both current momentum conditions and recent crossover information.
4.7. Integrated Trading Intelligence and Market Classification
The final trading intelligence engine combines three analytical components:
RSI momentum.
SMA and EMA positioning.
MACD momentum.
Each available directional confirmation contributes one bullish or bearish point.
The resulting bullish score represents the proportion of bullish confirmations relative to all available directional confirmations.
The classification follows three primary market conditions:
BULLISH: bullish score of at least 65%.
BEARISH: bullish score of 35% or lower.
NEUTRAL: bullish score between 35% and 65%.
When no valid directional confirmations are available, the system returns INSUFFICIENT DATA.
This scoring approach provides a simplified way to summarize multiple technical indicators into one market classification.
However, the score represents the proportion of directional indicator confirmations, not the statistical probability that the cryptocurrency price will increase.
4.8. Technical Visualization and Analytical Exports
The dashboard generates three technical chart categories for each cryptocurrency.
Moving Average Visualization
Displays SMA and EMA values to examine their relative positioning and potential trend conditions.
RSI Visualization
Presents momentum values with overbought, oversold, and midpoint reference levels.
MACD Visualization
Displays the MACD line, signal line, and histogram to examine momentum differences and potential directional changes.
The system also exports six CSV files:
Output file | Description |
|---|---|
| Integrated BTC technical indicator observations. |
| Integrated ETH technical indicator observations. |
| Final market classifications and directional scores. |
| Indicator completeness and valid observation reports. |
| Indicator processing and availability status. |
| Available timeframe, timestamp, and period metadata for standard indicators. |
These datasets provide a foundation for further quantitative research, historical analysis, and the development of more advanced trading models.
4.9. Limitations and Future Improvements
Several limitations should be considered when interpreting the analytical results.
First, indicator availability depends on the API response. Failed requests or missing values can reduce the number of available directional confirmations and influence the final market classification.
Second, BBANDS is requested but not integrated into the final scoring engine. Although Bollinger Bands is included in the API request candidates, the final data integration focuses on SMA, EMA, RSI, and MACD.
Third, the observation alignment process assumes synchronized indicator series. The implementation aligns observations by their ending positions rather than matching actual timestamps. Consequently, different indicator series could represent different market observations if their API responses have different date coverage.
Fourth, the scoring methodology uses equal directional weights. RSI, moving average positioning, and MACD each contribute one point when they produce bullish or bearish classifications. This approach does not account for differences in indicator reliability or market conditions.
Fifth, overbought and oversold RSI conditions do not contribute directional points. This means that an extreme RSI reading can appear in the dashboard without influencing the final bullish or bearish score.
Sixth, the framework does not perform historical backtesting. It therefore cannot establish whether the generated classifications would have produced profitable trading results under historical market conditions.
Future improvements could include timestamp-based indicator synchronization, Bollinger Bands integration, weighted technical scoring, volatility analysis, historical backtesting, and automated monitoring of signal changes.
Additional developments could also incorporate trading volume, price action, support and resistance levels, and risk management calculations.
These improvements would provide a more comprehensive foundation for systematic cryptocurrency trading analysis.
5. Conclusion
Crypto Technical Intelligence demonstrates how Python can integrate multiple technical indicators into an automated cryptocurrency analysis framework.
The system retrieves SMA, EMA, RSI, MACD, and BBANDS information for Bitcoin and Ethereum through the MarketFlow All-in-One Market Finance API.
Its data processing architecture incorporates JSON extraction, column normalization, numeric conversion, indicator validation, and specialized MACD parsing to accommodate different API response structures.
The final analytical engine combines RSI momentum, SMA and EMA positioning, and MACD conditions to calculate bullish scores and generate BULLISH, BEARISH, NEUTRAL, or INSUFFICIENT DATA classifications.
The framework also provides technical visualizations, data quality reports, indicator processing summaries, and downloadable CSV datasets.
Although the system offers a structured approach to monitoring BTC and ETH technical conditions, its market classifications should be interpreted as analytical indicators rather than guaranteed price predictions or direct trading recommendations.
Future development should focus on improving observation synchronization, integrating additional indicators, introducing weighted scoring mechanisms, and conducting historical backtesting.
With these improvements, Crypto Technical Intelligence can serve as a foundation for more advanced cryptocurrency market research and systematic trading decision-support systems.