
Cryptocurrency markets are characterized by high volatility, continuous trading activity, and rapidly changing liquidity conditions. Understanding market movements therefore requires more than monitoring price charts and technical indicators. Traders also need to examine the order book to identify the distribution of buying and selling liquidity, detect unusually large orders, and evaluate potential support and resistance areas.
The order book provides information about outstanding buy and sell orders at different price levels. Buy orders, commonly referred to as bids, represent demand from market participants, while sell orders, known as asks, represent available supply. Comparing the notional value of these orders can help traders understand the liquidity distribution around the current market price.
One important concept in order book analysis is liquidity wall detection. A liquidity wall refers to an unusually large concentration of orders at a particular price level. Large bid concentrations may indicate potential support areas, while large ask concentrations may indicate potential resistance areas. However, these orders are not guaranteed to remain in the order book because participants can modify or cancel them at any time.
Python provides an efficient environment for developing automated cryptocurrency market intelligence systems. By connecting to exchange APIs, traders can retrieve live order book snapshots, process bid and ask data, calculate liquidity imbalances, identify large order concentrations, and generate structured market reports. Libraries such as Requests, Pandas, and NumPy support data acquisition and quantitative calculations, while data visualization tools can be integrated for further analysis.
This article presents Crypto Market Intelligence Pro, a Python-based analytical framework that combines Binance market data with additional cryptocurrency information from the MarketFlow All-in-One Market Finance API. The implementation focuses on BTCUSDT and retrieves up to 1,000 order book levels from the Binance public market-data API.
The framework evaluates buy-side and sell-side liquidity, calculates the midpoint price, identifies unusually large order levels, measures the distance of liquidity walls from the midpoint, and groups nearby price levels into liquidity clusters. It also calculates a depth imbalance score to describe the relative distribution of buying and selling liquidity.
In addition to BTCUSDT order book analysis, the system retrieves supplementary cryptocurrency information for XRP-USD.AGR through the MarketFlow API. This additional dataset is displayed in the final report to provide another source of cryptocurrency information.
The implementation is organized into five computational cells covering API configuration, market data acquisition, order book parsing, liquidity intelligence calculations, and final market reporting.
The objective is to demonstrate how Python can transform raw cryptocurrency order book data into structured liquidity intelligence. The resulting analysis can help traders identify areas of concentrated liquidity and understand the balance between visible buying and selling orders. Nevertheless, order book information represents a snapshot of market conditions and should not be interpreted as a guaranteed prediction of future price movements.
2. Methodology
Crypto Market Intelligence Pro consists of five computational stages.
Cell 1 — Library Import and API Configuration: imports Python libraries, configures RapidAPI authentication, defines BTCUSDT as the primary instrument, and establishes the order book depth limit.
Cell 2 — Market Data Acquisition: retrieves Binance order book data, the latest BTCUSDT ticker price, and supplementary XRP information from MarketFlow.
Cell 3 — Order Book Parsing and Wall Detection: converts bid and ask records into structured DataFrames, calculates notional values, identifies unusually large order levels, and measures their distance from the midpoint price.
Cell 4 — Liquidity Intelligence Engine: calculates total buy and sell liquidity, liquidity shares, imbalance percentages, depth scores, and price-based liquidity clusters.
Cell 5 — Final Trading Intelligence Report: summarizes BTCUSDT market conditions, presents the strongest buy and sell walls, interprets the liquidity imbalance, and displays supplementary XRP information.
2.1. Order Book Data Acquisition
The system retrieves order book information using the Binance public market-data endpoint:
/api/v3/depth
The request uses BTCUSDT as the trading pair and retrieves up to 1,000 levels for both bids and asks.
The latest ticker price is separately retrieved through:
/api/v3/ticker/price
The system also requests supplementary cryptocurrency information for XRP-USD.AGR through the MarketFlow crypto-details endpoint.
2.2. Order Book Notional Calculation
Each order book record contains a price and quantity. The system calculates the notional value of each order level using:
\[ Notional = Price \times Quantity \]
The calculation provides a monetary representation of the visible order size in USDT.
For example, a BTCUSDT bid containing 2 BTC at a price of 78,000 USDT has a notional value of:
\[ 2 \times 78,000 = 156,000\ USDT \]
This allows order levels with different prices and quantities to be compared using a common monetary measure.
2.3. Midpoint Price Calculation
The midpoint price is calculated using the best bid and best ask:
\[ MidPrice = \frac{BestBid + BestAsk}{2} \]
The midpoint provides a reference for evaluating the relative distance of each order level from the center of the current bid-ask spread.
2.4. Liquidity Wall Detection
The system identifies unusually large order levels separately for the buy and sell sides.
For each side, the wall threshold is defined as:
\[ Threshold = \max(3 \times Median,\ P90) \]
Where:
Median represents the median notional value of the order levels.
P90 represents the 90th percentile of the notional distribution.
An order level is classified as a liquidity wall when its notional value is greater than or equal to the corresponding threshold.
This statistical approach allows the system to identify unusually large orders relative to the observed order book rather than relying on a fixed monetary threshold.
2.5. Liquidity Imbalance and Depth Score
The system calculates the total buy and sell liquidity by summing the notional values of the retrieved order levels.
The liquidity imbalance is calculated as:
\[ Imbalance = \frac{BuyLiquidity-SellLiquidity} {BuyLiquidity+SellLiquidity} \times100 \]
The buy and sell liquidity shares are calculated as:
\[ BuyShare = \frac{BuyLiquidity}{TotalLiquidity} \times100 \]
\[ SellShare = \frac{SellLiquidity}{TotalLiquidity} \times100 \]
The depth score is defined as:
\[ DepthScore = \operatorname{clip} \left(50+\frac{Imbalance}{2},0,100\right) \]
The score ranges from 0 to 100, with 50 representing an equal distribution between the captured buy and sell liquidity.
Importantly, the depth score is an order book balance indicator, not a probability of price increasing or decreasing.
2.6. Liquidity Clustering
The framework groups nearby order levels into price bands using 0.1% intervals relative to the midpoint price.
Each cluster contains:
Trading side.
Price band.
Total notional value.
Number of order levels.
Average price.
This aggregation helps identify areas where multiple orders are concentrated within a relatively narrow price range.
3. Implementation and Python Code
The implementation below follows the five-cell structure of the uploaded crypto_market_intelligence_pro.py file. Each cell performs a specific analytical function and shares its results with the following cell.
Cell 1 — Import Libraries and Configure API
The first cell imports the required Python libraries and establishes the API configuration.
Binance is used as the primary source for BTCUSDT order book and ticker information, while MarketFlow provides supplementary cryptocurrency details.
The system defines BTCUSDT as the main trading instrument, XRP-USD.AGR as the supplementary cryptocurrency identifier, and 1,000 as the requested order book depth.
The RapidAPI key is entered securely using getpass and is only required for the MarketFlow endpoint.
Code — Cell 1
import requests
import pandas as pd
import numpy as np
import json
from urllib.parse import quote
from IPython.display import display, Markdown

# MarketFlow
API_KEY = getpass.getpass("RapidAPI Key: ")

BASE_URL = "https://marketflow-all-in-one-market-finance-api.p.rapidapi.com"

HEADERS = {
    "x-rapidapi-key": API_KEY,
    "x-rapidapi-host": "marketflow-all-in-one-market-finance-api.p.rapidapi.com"
}

# Trading configuration
SYMBOL = "BTCUSDT"
DETAIL_TICKER = "XRP-USD.AGR"

BINANCE_URL = "https://data-api.binance.vision"

ORDERBOOK_LIMIT = 1000

print("CRYPTO MARKET INTELLIGENCE PRO")
print("Symbol:", SYMBOL)
print("Orderbook Depth:", ORDERBOOK_LIMIT)
Cell 2 — Cryptocurrency Market Data Acquisition
The second cell retrieves three categories of market information.
First, the Binance order book endpoint provides bid and ask levels for BTCUSDT. Second, the Binance ticker endpoint retrieves the latest available BTCUSDT price. Third, the MarketFlow API retrieves supplementary information for XRP-USD.AGR.
Each API request is protected by exception handling. If an individual request fails, the corresponding variable is assigned None and the error is displayed.
The order book response is also validated to ensure that the bids and asks fields are available before the analysis continues.
Code — Cell 2
# 1. BINANCE ORDERBOOK
try:
    response = requests.get(
        f"{BINANCE_URL}/api/v3/depth",
        params={
            "symbol": SYMBOL,
            "limit": ORDERBOOK_LIMIT
        },
        timeout=30
    )
    response.raise_for_status()
    depth_raw = response.json()

    if "bids" not in depth_raw or "asks" not in depth_raw:
        raise ValueError(f"Invalid orderbook: {depth_raw}")

    print("BINANCE ORDERBOOK: SUCCESS")

except Exception as e:
    depth_raw = None
    print("BINANCE ERROR:", e)


# 2. BINANCE TICKER
try:
    ticker_response = requests.get(
        f"{BINANCE_URL}/api/v3/ticker/price",
        params={"symbol": SYMBOL},
        timeout=30
    )
    ticker_response.raise_for_status()
    ticker_raw = ticker_response.json()
    current_price = float(ticker_raw["price"])

    print("BINANCE PRICE: SUCCESS")

except Exception as e:
    ticker_raw = None
    current_price = None
    print("TICKER ERROR:", e)


# 3. MARKETFLOW CRYPTO DETAILS
try:
    detail_response = requests.get(
        f"{BASE_URL}/crypto-details/{quote(DETAIL_TICKER, safe='')}",
        headers=HEADERS,
        params={"lang": "en"},
        timeout=30
    )
    detail_response.raise_for_status()
    details_raw = detail_response.json()

    if isinstance(details_raw, dict) and details_raw.get("error"):
        raise ValueError(details_raw["error"])

    print("MARKETFLOW DETAILS: SUCCESS")

except Exception as e:
    details_raw = None
    print("DETAIL ERROR:", e)


print("\nDATA ACQUISITION COMPLETE")
Cell 3 — Order Book Parsing and Liquidity Wall Detection
The third cell converts the raw Binance order book into structured Pandas DataFrames.
The parse_side() function extracts the price and quantity of each order and calculates its notional value. The bid records are labeled BUY, while the ask records are labeled SELL.
Both datasets are then combined into a single DataFrame called walls_df.
The system calculates separate wall thresholds for buying and selling liquidity using the median notional value multiplied by three or the 90th percentile, whichever is higher.
Order levels meeting these thresholds are classified as liquidity walls.
Finally, the program calculates the percentage distance of each order level from the midpoint price and ranks all order levels by notional value.
This produces a structured dataset for identifying the largest visible liquidity concentrations.
Code — Cell 3
if depth_raw is None:
    raise RuntimeError("Orderbook unavailable. Check Cell 2.")

mid_price = (
    float(depth_raw["bids"][0][0]) +
    float(depth_raw["asks"][0][0])
) / 2

def parse_side(data, side):
    df = pd.DataFrame(data, columns=["price", "quantity"])

    df["price"] = pd.to_numeric(df["price"])
    df["quantity"] = pd.to_numeric(df["quantity"])
    df["notional"] = df["price"] * df["quantity"]
    df["side"] = side

    return df

bids_df = parse_side(depth_raw["bids"], "BUY")
asks_df = parse_side(depth_raw["asks"], "SELL")

walls_df = pd.concat(
    [bids_df, asks_df],
    ignore_index=True
)

# Detect unusually large order levels
thresholds = {}

for side in ["BUY", "SELL"]:
    subset = walls_df[walls_df["side"] == side]

    thresholds[side] = max(
        subset["notional"].median() * 3,
        subset["notional"].quantile(0.90)
    )

walls_df["wall_threshold"] = walls_df["side"].map(thresholds)

walls_df["is_wall"] = (
    walls_df["notional"] >= walls_df["wall_threshold"]
)

# Distance from midpoint
walls_df["distance_pct"] = (
    (walls_df["price"] - mid_price) /
    mid_price * 100
)

walls_df["distance_pct"] = walls_df["distance_pct"].round(4)

walls_df = walls_df.sort_values(
    "notional",
    ascending=False
).reset_index(drop=True)

print("CURRENT PRICE:", current_price)
print("ORDERBOOK MIDPRICE:", round(mid_price, 4))
print("TOTAL LEVELS:", len(walls_df))
print("DETECTED WALLS:", int(walls_df["is_wall"].sum()))

display(
    walls_df[[
        "side", "price", "quantity",
        "notional", "distance_pct", "is_wall"
    ]].head(20)
)
Cell 4 — Liquidity Intelligence Engine
The fourth cell performs the main quantitative liquidity analysis.
The system calculates the total notional value of all captured buy and sell orders and uses these values to determine the liquidity imbalance and respective market shares.
A depth score is then calculated using the imbalance formula. The market bias is classified into three categories:
BULLISH DEPTH: buy liquidity exceeds sell liquidity by more than 10%.
BEARISH DEPTH: sell liquidity exceeds buy liquidity by more than 10%.
NEUTRAL DEPTH: the imbalance remains between -10% and +10%.
The cell also extracts the strongest buy and sell walls and groups nearby price levels into 0.1% liquidity bands. The aggregated clusters are ranked by total notional value to identify areas with the largest concentrations of visible orders.
Code — Cell 4
buy_liquidity = bids_df["notional"].sum()
sell_liquidity = asks_df["notional"].sum()

total_liquidity = buy_liquidity + sell_liquidity

imbalance = (
    (buy_liquidity - sell_liquidity) /
    total_liquidity * 100
)

buy_share = buy_liquidity / total_liquidity * 100
sell_share = sell_liquidity / total_liquidity * 100

# Depth imbalance score (NOT probability)
depth_score = np.clip(50 + imbalance / 2, 0, 100)

if imbalance > 10:
    market_bias = "BULLISH DEPTH"
elif imbalance < -10:
    market_bias = "BEARISH DEPTH"
else:
    market_bias = "NEUTRAL DEPTH"

# Strongest wall levels
buy_walls = walls_df[
    (walls_df["side"] == "BUY") &
    (walls_df["is_wall"])
].sort_values("notional", ascending=False)

sell_walls = walls_df[
    (walls_df["side"] == "SELL") &
    (walls_df["is_wall"])
].sort_values("notional", ascending=False)

# Liquidity clustering: 0.1% price bands
walls_df["price_band"] = np.floor(
    (walls_df["price"] / mid_price - 1) / 0.001
).astype(int)

clusters = (
    walls_df.groupby(["side", "price_band"])
    .agg(
        total_notional=("notional", "sum"),
        order_count=("price", "count"),
        avg_price=("price", "mean")
    )
    .reset_index()
    .sort_values("total_notional", ascending=False)
)

print("LIQUIDITY METRICS")

display(pd.DataFrame({
    "Metric": [
        "Current Price",
        "Buy Liquidity",
        "Sell Liquidity",
        "Buy Share",
        "Sell Share",
        "Liquidity Imbalance",
        "Depth Score",
        "Market Bias"
    ],
    "Value": [
        current_price,
        buy_liquidity,
        sell_liquidity,
        f"{buy_share:.2f}%",
        f"{sell_share:.2f}%",
        f"{imbalance:.2f}%",
        f"{depth_score:.2f}/100",
        market_bias
    ]
}))

print("\nSTRONGEST BUY WALLS")
display(buy_walls.head(10))

print("\nSTRONGEST SELL WALLS")
display(sell_walls.head(10))

print("\nTOP LIQUIDITY CLUSTERS")
display(clusters.head(15))
Cell 5 — Final Crypto Market Intelligence Report
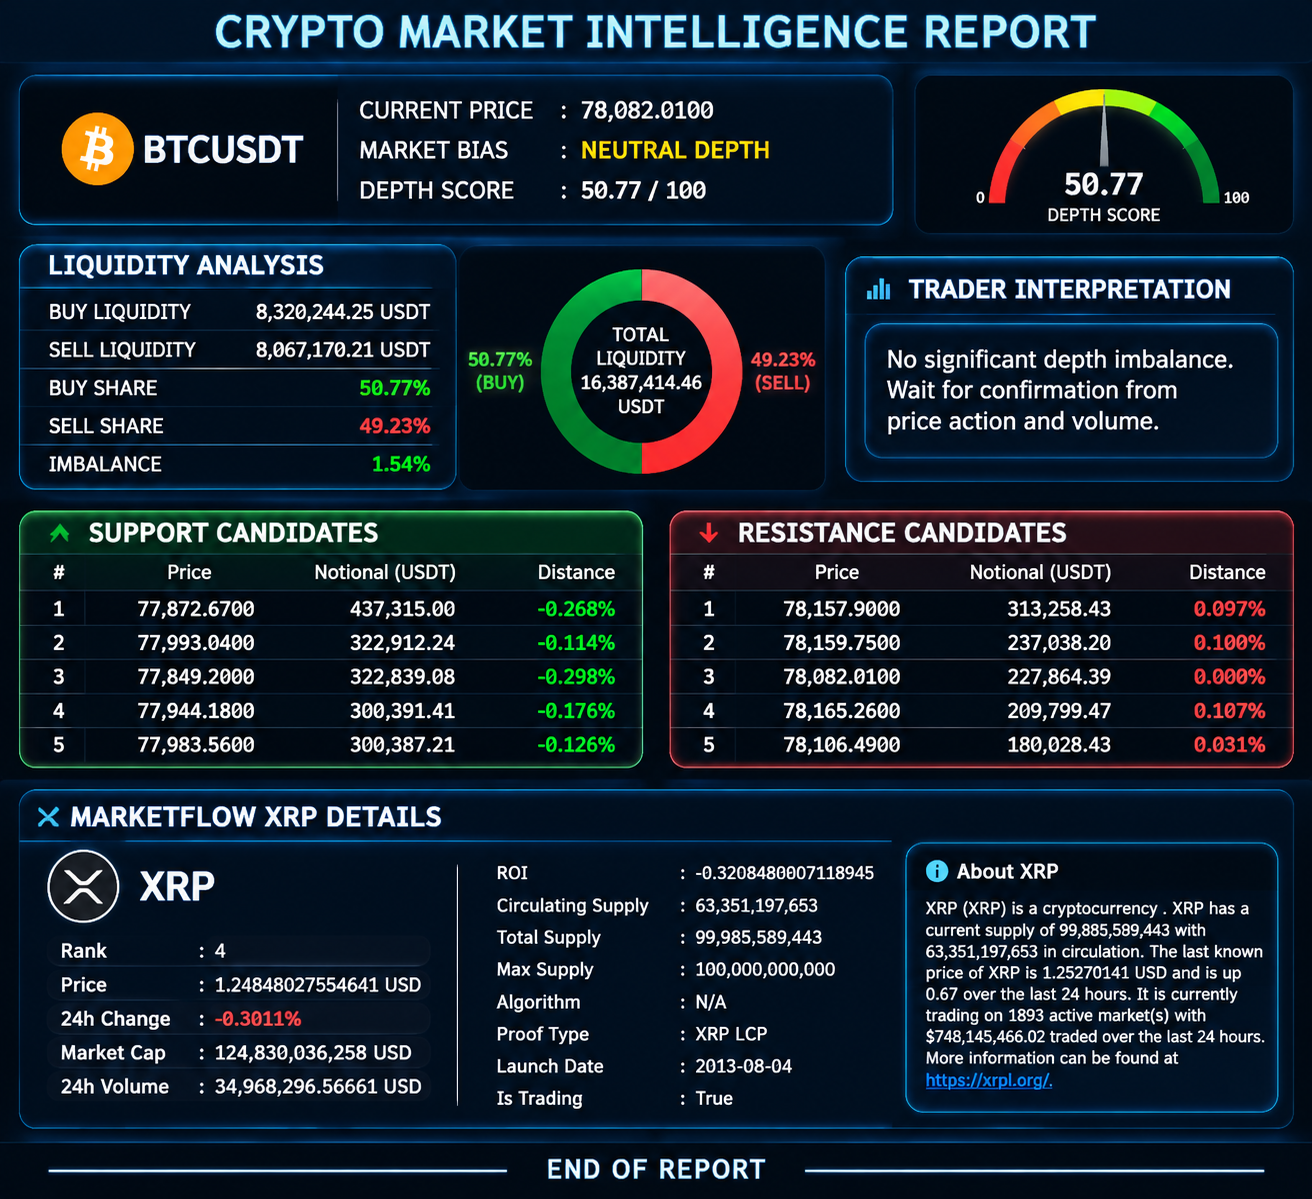
The fifth cell consolidates the analytical results into a final market intelligence report.
The report displays the selected trading symbol, latest ticker price, market bias, and depth score. It then presents the total buy and sell liquidity, their respective shares, and the calculated imbalance.
The strongest five buy walls are reported as potential support candidates, while the strongest five sell walls are presented as potential resistance candidates.
Each candidate includes its price level, notional value in USDT, and percentage distance from the midpoint.
The final interpretation explains whether visible buying or selling liquidity dominates the captured order book. Supplementary XRP information retrieved from MarketFlow is also displayed in JSON format.
Code — Cell 5
print("=" * 65)
print("       CRYPTO MARKET INTELLIGENCE REPORT")
print("=" * 65)

print(f"\nSYMBOL          : {SYMBOL}")
print(f"CURRENT PRICE   : {current_price:,.4f}")
print(f"MARKET BIAS     : {market_bias}")
print(f"DEPTH SCORE     : {depth_score:.2f}/100")

print("\n--- LIQUIDITY ANALYSIS ---")
print(f"BUY LIQUIDITY   : {buy_liquidity:,.2f} USDT")
print(f"SELL LIQUIDITY  : {sell_liquidity:,.2f} USDT")
print(f"BUY SHARE       : {buy_share:.2f}%")
print(f"SELL SHARE      : {sell_share:.2f}%")
print(f"IMBALANCE       : {imbalance:.2f}%")

print("\n--- SUPPORT CANDIDATES ---")

if len(buy_walls):
    for _, row in buy_walls.head(5).iterrows():
        print(
            f"Price: {row['price']:,.4f} | "
            f"Notional: {row['notional']:,.2f} USDT | "
            f"Distance: {row['distance_pct']:.3f}%"
        )
else:
    print("No unusually large bid levels detected.")

print("\n--- RESISTANCE CANDIDATES ---")

if len(sell_walls):
    for _, row in sell_walls.head(5).iterrows():
        print(
            f"Price: {row['price']:,.4f} | "
            f"Notional: {row['notional']:,.2f} USDT | "
            f"Distance: {row['distance_pct']:.3f}%"
        )
else:
    print("No unusually large ask levels detected.")

print("\n--- TRADER INTERPRETATION ---")

if imbalance > 10:
    print("Buyer depth dominates the captured orderbook.")
    print("Monitor whether bid liquidity holds near support.")
elif imbalance < -10:
    print("Seller depth dominates the captured orderbook.")
    print("Monitor whether ask liquidity rejects price advances.")
else:
    print("No significant depth imbalance.")
    print("Wait for confirmation from price action and volume.")

print("\n--- MARKETFLOW XRP DETAILS ---")

if details_raw is not None:
    print(json.dumps(details_raw, indent=2, ensure_ascii=False)[:5000])
else:
    print("XRP details unavailable.")

print("\n" + "=" * 65)
print("END OF REPORT")
print("=" * 65)
Result:
4. Results and Discussion
4.1. BTCUSDT Order Book Data Acquisition
The data acquisition module retrieves BTCUSDT order book information from Binance and obtains the latest ticker price through a separate endpoint.
The order book response contains two primary datasets: bids and asks. These datasets represent the visible buy and sell orders available at different price levels.
By requesting up to 1,000 levels on each side, the framework can examine a broader distribution of visible liquidity than an analysis limited to the best bid and ask.
The retrieved data are used to calculate the midpoint price and establish the reference point for subsequent liquidity measurements.
The actual number of returned levels depends on the exchange response and available market data at the time of retrieval.
4.2. Order Book Notional Distribution
The order book parsing module transforms each price and quantity combination into a notional value expressed in USDT.
This calculation makes it possible to compare order levels according to their monetary size rather than their quantity alone.
The combined dataset contains the trading side, price, quantity, notional value, wall threshold, wall classification, and distance from the midpoint.
Sorting the dataset by notional value provides an initial overview of the largest visible orders in the captured order book.
This process is useful for identifying unusually large order levels that may influence short-term liquidity conditions.
4.3. Liquidity Wall Detection
The liquidity wall detection mechanism applies a statistical threshold independently to the buy and sell sides.
By combining three times the median notional value with the 90th percentile, the system identifies order levels that are unusually large relative to the observed distribution.
Buy walls are classified as potential support candidates, while sell walls are classified as potential resistance candidates.
The distance percentage helps traders understand how far each detected wall is positioned from the midpoint price.
However, a large visible order does not guarantee that the corresponding price level will hold as support or resistance. Orders may be canceled, modified, partially executed, or replaced by other market participants.
Therefore, liquidity walls should be monitored alongside actual price movements and executed trading volume.
4.4. Buy and Sell Liquidity Imbalance
The liquidity intelligence engine calculates the total notional value of captured bids and asks.
The resulting buy and sell liquidity shares provide a quantitative comparison of the visible order book distribution.
A positive imbalance indicates that the captured bid notional exceeds the ask notional. A negative imbalance indicates that the captured ask notional exceeds the bid notional.
The system classifies the resulting market bias into bullish depth, bearish depth, or neutral depth.
This classification provides a simplified description of the order book's current liquidity distribution.
It does not establish the direction of the next price movement because visible order book liquidity can change rapidly and does not represent all market participants or executed transactions.
4.5. Liquidity Depth Score
The depth score converts the liquidity imbalance into a scale ranging from 0 to 100.
A score above 50 indicates that buy-side liquidity dominates the captured order book, while a score below 50 indicates that sell-side liquidity dominates.
A score near 50 represents a relatively balanced distribution.
The score provides a standardized way to compare liquidity conditions across different observations. However, it is not a statistical probability, confidence level, or machine-learning prediction of future BTCUSDT price direction.
Its interpretation should remain limited to the captured order book snapshot.
4.6. Liquidity Clustering and Support-Resistance Candidates
The liquidity clustering component groups order levels into price bands separated by 0.1% intervals relative to the midpoint price.
For each cluster, the system calculates the total notional value, number of order levels, and average price.
This aggregation provides another perspective on liquidity concentration. Several moderately large orders located close to each other may form a significant liquidity cluster even when none individually satisfies the wall-detection threshold.
The strongest buy and sell walls are then presented as potential support and resistance candidates.
Combining individual wall detection with cluster analysis can help traders distinguish isolated large orders from broader concentrations of visible liquidity.
4.7. Supplementary Cryptocurrency Information
The framework also retrieves supplementary XRP-USD.AGR information through the MarketFlow API.
This information is displayed separately from the BTCUSDT order book analysis. The two datasets provide different types of market information and should not be treated as if they represent the same trading instrument.
The supplementary XRP response can be examined to identify additional cryptocurrency information available through the API, while BTCUSDT remains the primary instrument for the order book calculations.
4.8. Limitations and Future Improvements
Several limitations should be considered when interpreting the results.
First, the analysis represents an order book snapshot. The system retrieves visible liquidity at a particular point in time and does not continuously track changes in order placement, cancellation, or execution.
Second, the order book only represents available visible liquidity on the selected Binance market. It does not include the complete liquidity distribution across other cryptocurrency exchanges or private trading venues.
Third, liquidity wall detection uses adaptive statistical thresholds. Although this approach identifies unusually large orders relative to the captured dataset, it does not establish whether those orders represent genuine long-term support or resistance.
Fourth, the depth score is not a directional probability. It measures the relative distribution of captured buy and sell notional values and should not be interpreted as a guaranteed prediction of market movement.
Fifth, supplementary XRP information is not integrated into the BTCUSDT liquidity calculations. The XRP dataset is displayed separately and does not influence the BTCUSDT market bias.
Future improvements could include continuous order book monitoring, historical liquidity tracking, order cancellation analysis, cross-exchange liquidity comparison, trade-volume integration, and automated liquidity change detection.
Additional visualization features could also help present liquidity walls and clusters directly on BTCUSDT price charts.
These improvements would create a more comprehensive cryptocurrency market intelligence framework for monitoring liquidity conditions and evaluating potential trading areas.
5. Conclusion
Crypto Market Intelligence Pro demonstrates how Python can be used to retrieve, process, and analyze cryptocurrency order book data to identify liquidity concentrations and evaluate the balance between visible buying and selling orders.
The framework integrates Binance order book acquisition, ticker price retrieval, MarketFlow cryptocurrency information, notional value calculations, statistical liquidity wall detection, midpoint distance measurement, liquidity imbalance calculations, and price-band clustering.
The resulting report provides a structured overview of BTCUSDT market liquidity, including the strongest visible buy and sell walls, potential support and resistance candidates, liquidity shares, and the depth imbalance score.
These analytical outputs can help traders better understand the distribution of visible market liquidity and identify price levels that deserve further monitoring.
Nevertheless, order book analysis has important limitations. Large orders can be modified or canceled, liquidity conditions can change rapidly, and visible order book depth does not necessarily represent the complete market.
The depth score should therefore be interpreted as a liquidity distribution indicator rather than a probability of price movement or an automatic trading signal.
Future development should prioritize real-time order book monitoring, historical liquidity analysis, cross-exchange comparisons, and integration with price action and executed volume data.
With these improvements, Crypto Market Intelligence Pro can serve as a foundation for more advanced cryptocurrency liquidity research and systematic market monitoring.