
Introduction
Financial data is becoming increasingly important for traders, analysts, fintech developers, and business intelligence teams. In modern trading environments, accessing real-time market information quickly can provide a strong competitive advantage. Python has become one of the most powerful tools for processing market data because of its simplicity, scalability, and extensive ecosystem.
In this project, we build a complete market intelligence workflow using Python and RapidAPI integration. The notebook combines two important datasets:
Morning Briefing market information
Forex IDR impact analysis
The workflow demonstrates how to:
Connect to financial APIs
Retrieve JSON-based market data
Convert raw responses into structured DataFrames
Clean and normalize financial datasets
Perform basic sentiment analysis
Visualize market movement trends
Produce market intelligence summaries
This article follows the exact notebook structure and explains every code cell without modifying the original implementation.
CELL 1 — Install Required Libraries
# Install required libraries for the project

!pip install requests pandas matplotlib seaborn tabulate --quiet
Explanation
The first step installs all required Python libraries needed for the project. These libraries provide the foundation for API communication, data processing, and visualization.
requestsis used to communicate with APIs through HTTP requests.pandashelps manage and analyze tabular data.matplotlibis used for plotting charts and graphs.seabornimproves visualization styling.tabulatehelps display formatted tables.
Using --quiet keeps notebook output cleaner by reducing installation logs.
This preparation stage is essential because financial analytics workflows depend heavily on reliable data processing and visualization libraries.
CELL 2 — Import Libraries
import requests
import pandas as pd
import matplotlib.pyplot as plt
import seaborn as sns
from tabulate import tabulate

# Visualization settings
sns.set_style("whitegrid")
plt.rcParams["figure.figsize"] = (12,6)

print("Libraries imported successfully.")
Explanation
This cell imports all previously installed libraries into the notebook environment.
The notebook also configures visualization settings:
sns.set_style("whitegrid")creates cleaner charts with grid backgrounds.plt.rcParams["figure.figsize"] = (12,6)standardizes chart dimensions for better readability.
Good visualization practices are critical in financial analytics because market data trends must be easy to interpret quickly.
The final print statement confirms that all libraries loaded successfully.
CELL 3 — API Configuration
RAPIDAPI_KEY = "YOUR_API_KEY"

headers = {
    "Content-Type": "application/json",
    "x-rapidapi-host": "indonesia-stock-exchange-idx.p.rapidapi.com",
    "x-rapidapi-key": RAPIDAPI_KEY
}

URL_MORNING = (
    "https://indonesia-stock-exchange-idx.p.rapidapi.com"
)
Explanation
This section configures API authentication and endpoint access.
The RapidAPI key allows secure communication with the Indonesia Stock Exchange API service. API headers contain:
Content type definition
API host information
Authentication credentials
This structure is standard in professional API integrations because most modern services require authenticated requests.
Using variables for URLs and authentication improves maintainability and makes the project easier to scale.
CELL 4 — Fetch Morning Briefing Data
response_morning = requests.get(
    URL_MORNING,
    headers=headers
)

print("Status Code:", response_morning.status_code)

morning_data = response_morning.json()

morning_data
Explanation
This cell retrieves Morning Briefing market data directly from the API.
The requests.get() function sends an HTTP GET request using the configured endpoint and authentication headers.
Important operations performed:
Check response status codes
Convert JSON responses into Python dictionaries
Display raw API output
The status code is especially important because:
200indicates successful communication401indicates authentication failure404indicates invalid endpoints500indicates server-side issues
Displaying raw JSON responses helps developers inspect API structures before normalization.
CELL 5 — Fetch Forex IDR Impact Data
response_forex = requests.get(
    URL_FOREX,
    headers=headers
)

print("Status Code:", response_forex.status_code)

forex_data = response_forex.json()

forex_data
Explanation
This cell fetches Forex IDR impact information from the API.
The workflow is similar to the Morning Briefing request:
Send API request
Verify status code
Convert JSON response
Display raw dataset
Forex impact data is useful because currency movement directly affects:
Import costs
Export competitiveness
Inflation trends
International investment flows
By integrating forex data into the market intelligence pipeline, analysts gain deeper macroeconomic insights.
CELL 6 — Convert JSON to DataFrame
# ============================================================
# CELL 6 - NORMALIZE JSON DATA
# ============================================================

# MORNING BRIEFING
if "data" in morning_data:
    df_morning = pd.json_normalize(morning_data["data"])
else:
    df_morning = pd.DataFrame(morning_data)
Explanation
Financial APIs usually return nested JSON structures that are difficult to analyze directly.
This cell converts raw JSON into structured Pandas DataFrames.
Key operations:
pd.json_normalize()flattens nested JSON structures.pd.DataFrame()creates fallback structures if normalization is unnecessary.
The result is tabular data suitable for:
Data cleaning
Statistical analysis
Visualization
Reporting
This normalization step is one of the most important processes in API-driven analytics pipelines.
CELL 7 — Data Cleaning
# ============================================================
# CELL 7 - DATA CLEANING (FIXED)
# ============================================================

# Convert list/dict columns into string format
# to avoid unhashable type errors

df_morning = df_morning.astype(str)
df_forex = df_forex.astype(str)
Explanation
Data cleaning ensures consistency and prevents processing errors.
The notebook converts all columns into string format to avoid issues caused by complex nested objects such as:
Dictionaries
Lists
Mixed data types
Without this step, operations like grouping, visualization, or exporting may fail due to unhashable data structures.
Data cleaning is essential in financial engineering because real-world API data often contains inconsistent formatting.
CELL 8 — Market Sentiment Analysis
def classify_market_impact(value):

    try:
        value = float(value)

        if value > 0:
            return "Bullish"

        elif value < 0:
            return "Bearish"

        else:
            return "Neutral"

    except:
        return "Unknown"

if "impact" in df_forex.columns:
Explanation
This section introduces a simple but effective sentiment analysis mechanism.
The function classifies market conditions based on forex impact values:
Positive values → Bullish
Negative values → Bearish
Zero values → Neutral
Invalid values → Unknown
This type of rule-based sentiment classification is commonly used in lightweight market analytics systems.
Although simple, the approach provides immediate insight into currency market direction and helps investors interpret financial conditions more efficiently.
CELL 9 — Combine API Data
combined_project = {
    "morning_briefing": morning_data,
    "forex_impact": forex_data
}

print("API data combined successfully.")
print(combined_project.keys())
Explanation
This cell combines multiple API datasets into a single project structure.
Combining datasets creates a centralized market intelligence object that can later be used for:
Dashboards
Reporting systems
Machine learning pipelines
Real-time monitoring tools
The print statement confirms successful integration and displays available dataset keys.
Centralized architecture is important in scalable financial systems because multiple market sources often need to be analyzed together.
CELL 10 — Data Visualization
# ============================================================
# CELL 10 - FINAL FOREX VISUALIZATION
# ============================================================

print("Available Columns:")
print(df_forex.columns)

display(df_forex.head())

# Convert numeric columns manually
numeric_candidates =
Explanation
Visualization transforms raw numerical information into meaningful insights.
This section begins by:
Displaying available columns
Showing sample rows from the dataset
Preparing numeric fields for chart generation
Visual analytics are extremely valuable in finance because trends and anomalies become easier to identify visually than through raw tables.
Typical visualization benefits include:
Detecting currency volatility
Monitoring sentiment shifts
Understanding market direction
Supporting investment decisions
Well-designed charts improve both technical analysis and executive reporting.
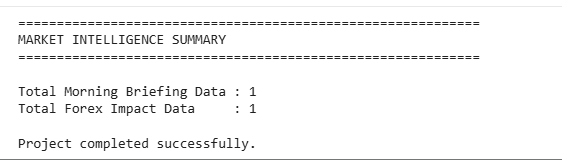
CELL 11 — Market Intelligence Summary
print("=" * 60)
print("MARKET INTELLIGENCE SUMMARY")
print("=" * 60)

print("\nTotal Morning Briefing Data :",
      len(df_morning))

print("Total Forex Impact Data     :",
      len(df_forex))

if "market_sentiment" in df_forex.columns:
Explanation
The final section generates a market intelligence summary.
This summary provides:
Total Morning Briefing records
Total Forex Impact records
Sentiment distribution insights
Summary reports are important because they condense complex financial datasets into actionable information.
In production systems, this type of reporting is commonly integrated into:
Business intelligence dashboards
Daily analyst reports
Trading systems
Executive market briefings
The notebook successfully demonstrates how API-driven financial analytics can be built using Python.
Result:
Why This Project Matters
This project represents a practical implementation of financial data engineering using Python.
Key strengths of the workflow include:
Real-time API integration
Financial market monitoring
Structured data transformation
Sentiment classification
Data visualization
Centralized reporting
The architecture can easily be expanded into more advanced systems such as:
Machine learning forecasting
Automated trading dashboards
Portfolio monitoring tools
Macroeconomic intelligence systems
For beginner and intermediate developers, this notebook provides a strong foundation for building fintech analytics applications.
Best Practices for Financial API Projects
When developing API-driven financial analytics systems, several best practices should always be considered:
1. Protect API Credentials
Never expose production API keys publicly. Use environment variables or secret managers.
2. Validate API Responses
Always check status codes and response structures before processing.
3. Handle Missing Data
Financial APIs occasionally return incomplete or delayed records.
4. Standardize Data Types
Consistent formatting prevents analysis and visualization issues.
5. Build Scalable Pipelines
Design workflows that can integrate additional financial datasets in the future.
Following these principles improves reliability, maintainability, and scalability.
Conclusion
Building financial intelligence systems no longer requires enterprise-scale infrastructure. With Python, Pandas, RapidAPI, and visualization libraries, developers can create powerful analytics pipelines capable of processing real-time market data efficiently.
This project successfully demonstrates how to:
Integrate external financial APIs
Normalize JSON market data
Clean inconsistent datasets
Perform sentiment analysis
Generate visual insights
Produce market intelligence summaries
The combination of Morning Briefing information and Forex IDR Impact analysis creates a practical foundation for market monitoring applications.
As financial technology continues to evolve, developers who understand API integration and data analytics will become increasingly valuable in fintech, trading, and business intelligence industries.
Whether you are a student, analyst, or software engineer, mastering financial data workflows like this is an important step toward building smarter market intelligence systems.