
Introduction
Understanding stock market behaviour requires more than analysing price movement. Transaction flow, broker activity, and capital movement can provide additional information about market participants and possible market trends.
Smart money analysis focuses on identifying significant capital movement from active market participants. By analysing broker transactions and smart money flow, investors can gain additional insight into accumulation and distribution activities.
This project develops an IDX Smart Money Analysis Dashboard Using Python and IDX API. The system collects broker activity data, processes transaction information, calculates smart money scores, and displays analytical results through a visualization dashboard.
The project uses Python with IDX API, Pandas, and Matplotlib to transform raw market data into structured analysis.
Project Overview
The IDX Smart Money Analysis Dashboard combines three IDX API endpoints:
getBrokerActivitygetBrokerSummarygetSmartMoneyFlow
The main purpose of this project is to analyse BBCA stock activity by collecting broker transactions and evaluating smart money movement.
The workflow consists of:
API configuration.
Market data collection.
Data preprocessing.
Smart money scoring.
Dashboard visualization.
Cell 1 — Project Setup and Library Configuration
# ============================================
# PROJECT:
# IDX Smart Money & Broker Activity Analyzer
# ============================================

!pip install requests pandas matplotlib -q

import requests
import pandas as pd
import matplotlib.pyplot as plt
import json
import warnings

warnings.filterwarnings("ignore")


API_KEY = "YOUR_API_KEY"


BASE_URL = "https://indonesia-stock-exchange-idx.p.rapidapi.com"


HEADERS = {
    "Content-Type": "application/json",
    "x-rapidapi-host": "indonesia-stock-exchange-idx.p.rapidapi.com",
    "x-rapidapi-key": API_KEY
}


print("IDX Smart Money Analyzer Ready")
This section prepares the Python environment and connects the project with IDX API services.
The required libraries are installed and imported for API communication, data processing, and visualization.
Cell 2 — API Data Collector
# ============================================
# API DATA COLLECTOR
# ============================================


def getBrokerActivity(
    broker="DH",
    date="2026-01-02"
):

    url = f"{BASE_URL}/api/market-detector/broker-activity/{broker}"

    params = {
        "limit":50,
        "marketBoard":"MARKET_BOARD_ALL",
        "page":1,
        "investorType":"INVESTOR_TYPE_ALL",
        "transactionType":"TRANSACTION_TYPE_NET",
        "from":date,
        "to":date
    }


    response = requests.get(
        url,
        headers=HEADERS,
        params=params
    )

    return response.json()


def getBrokerSummary(
    stock="BBCA",
    date="2026-01-02"
):

    url = f"{BASE_URL}/api/market-detector/broker-summary/{stock}"

    params = {
        "limit":25,
        "marketBoard":"MARKET_BOARD_ALL",
        "transactionType":"TRANSACTION_TYPE_NET",
        "investorType":"INVESTOR_TYPE_ALL",
        "from":date,
        "to":date
    }


    response = requests.get(
        url,
        headers=HEADERS,
        params=params
    )

    return response.json()


def getSmartMoneyFlow(
    stock="BBCA",
    days=30
):

    url = f"{BASE_URL}/api/analysis/bandar/smart-money/{stock}"

    params = {
        "days":days
    }


    response = requests.get(
        url,
        headers=HEADERS,
        params=params
    )

    return response.json()
This cell creates three API functions to collect market information.
getBrokerActivity() retrieves broker transaction activity.
getBrokerSummary() collects transaction summary data for selected stocks.
getSmartMoneyFlow() retrieves smart money movement data used in the scoring process.
Cell 3 — Data Collection and Processing
# ============================================
# DATA COLLECTION
# ============================================


stock = "BBCA"
broker = "DH"


# Request API

activity_raw = getBrokerActivity(
    broker
)


summary_raw = getBrokerSummary(
    stock
)


smart_raw = getSmartMoneyFlow(
    stock,
    days=30
)


# ============================================
# CONVERT BROKER ACTIVITY
# ============================================


def extract_dataframe(data):

    if "data" in data:

        data = data["data"]


    if isinstance(data, dict):

        for key,value in data.items():

            if isinstance(value,list):

                return pd.DataFrame(value)


        return pd.DataFrame([data])


    return pd.DataFrame(data)


df_activity = extract_dataframe(
    activity_raw
)


df_summary = extract_dataframe(
    summary_raw
)


# ============================================
# CONVERT SMART MONEY
# ============================================


smart_data = smart_raw.get(
    "data",
    smart_raw
)


df_smart = extract_dataframe(
    smart_data
)


print("=== BROKER ACTIVITY ===")
display(df_activity.head())


print("=== BROKER SUMMARY ===")
display(df_summary.head())


print("=== SMART MONEY FLOW ===")
display(df_smart.head())
The collected JSON responses are converted into Pandas DataFrames.
This process allows the system to organize raw API responses into structured datasets that can be analysed numerically.
Cell 4 — Smart Money Scoring Engine
# ============================================
# SMART MONEY SCORING ENGINE
# ============================================


def smart_money_score(df, stock):

    temp = df.copy()


    # Convert numeric columns

    for col in temp.columns:

        temp[col] = pd.to_numeric(
            temp[col],
            errors="coerce"
        )


    numeric = temp.select_dtypes(
        include=["number"]
    )


    if numeric.empty:

        return {

            "Stock": stock,

            "Score":0,

            "Signal":
            "NO DATA",

            "Interpretation":
            "Data smart money tidak tersedia"

        }


    # Total flow

    total_flow = numeric.sum().sum()


    # Normalisasi sederhana

    max_value = numeric.abs().sum().sum()


    if max_value != 0:

        flow_ratio = (
            total_flow /
            max_value
        )

    else:

        flow_ratio = 0


    # Score 0-100

    score = round(
        (flow_ratio + 1) * 50,
        2
    )


    # Batasi score

    score = max(
        0,
        min(
            score,
            100
        )
    )


    # Signal

    if score >= 70:

        signal = "STRONG ACCUMULATION"


        interpretation = (
            "Smart money menunjukkan "
            "tekanan beli yang kuat"
        )


    elif score >= 55:

        signal = "MODERATE ACCUMULATION"


        interpretation = (
            "Terdapat indikasi akumulasi "
            "oleh pelaku pasar"
        )


    elif score >= 45:

        signal = "NEUTRAL"


        interpretation = (
            "Belum terdapat dominasi "
            "buyer atau seller"
        )


    else:

        signal = "DISTRIBUTION"


        interpretation = (
            "Terdapat indikasi tekanan jual"
        )


    return {

        "Stock":stock,

        "Smart Money Score":
        score,

        "Signal":
        signal,

        "Total Flow":
        total_flow,

        "Interpretation":
        interpretation

    }


smart_result = smart_money_score(
    df_smart,
    stock
)


print("SMART MONEY ANALYSIS")
print("====================")


for key,value in smart_result.items():

    print(
        key,
        ":",
        value
    )
The Smart Money Scoring Engine converts transaction flow data into a score between 0 and 100.
The generated score is classified into four market conditions:
Score | Signal |
|---|---|
70–100 | Strong Accumulation |
55–69 | Moderate Accumulation |
45–54 | Neutral |
Below 45 | Distribution |
This classification provides a simplified interpretation of market buying and selling pressure.
Cell 5 — Visualization Dashboard
# ============================================
# SIMPLE DASHBOARD
# ============================================


score = smart_result[
    "Smart Money Score"
]


signal = smart_result[
    "Signal"
]


plt.figure(
    figsize=(6,4)
)


plt.bar(
    ["Smart Money"],
    [score]
)


plt.ylim(
    0,
    100
)


plt.ylabel(
    "Score (0-100)"
)


plt.title(
    f"{stock} Smart Money Score"
)


plt.show()


print("\nFINAL INVESTMENT SIGNAL")
print("========================")

print(
    "Stock :",
    stock
)


print(
    "Score :",
    score,
    "/100"
)


print(
    "Signal :",
    signal
)


print(
    "\n",
    smart_result["Interpretation"]
)
The final stage visualizes the smart money score and displays the generated investment signal.
The dashboard provides a simple overview of market flow conditions based on available transaction data.
Results and Discussion
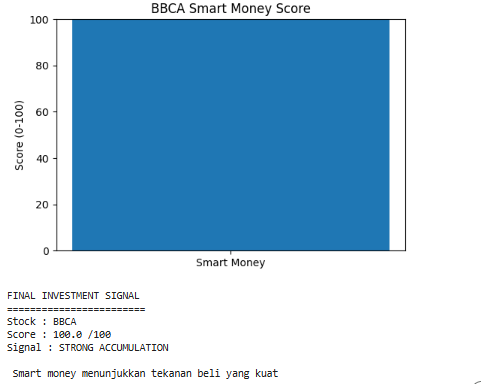
The IDX Smart Money Analysis Dashboard successfully integrates broker activity, broker summary, and smart money flow data into a single analytical workflow.
The system can automatically collect market data, process transaction information, calculate smart money scores, and display market signals.
This approach helps simplify the analysis of broker behaviour and capital movement. However, the generated signal should not be considered as the only investment decision factor.
Investors should combine this analysis with fundamental analysis, valuation analysis, technical indicators, and overall market conditions.
Conclusion
The IDX Smart Money Analysis Dashboard Using Python and IDX API demonstrates how programming can be applied to automate stock market transaction analysis.
By combining broker activity data, broker summary information, and smart money flow analysis, the project transforms raw market data into a structured dashboard.
Python, Pandas, and IDX API provide a strong foundation for developing more advanced financial analytics systems such as automated stock screening tools, real-time monitoring dashboards, and quantitative investment platforms.