
Understanding institutional trading activity has become increasingly important for investors seeking deeper insight into market behavior. Instead of relying solely on price movements, many traders analyze Smart Money Flow and Bandar Distribution to identify how large market participants accumulate or distribute shares.
The Indonesia Stock Exchange API provides access to these datasets through dedicated analysis endpoints. By retrieving this information programmatically, investors and developers can automate data collection, simplify market monitoring, and integrate institutional trading indicators into their own analytical workflows.
In this tutorial, we build a Smart Money Flow and Bandar Distribution Dashboard using Python and the Indonesia Stock Exchange API. The notebook retrieves Smart Money Flow data for one stock and Bandar Distribution data for another, converts the API responses into structured pandas DataFrames, and generates a concise summary of both datasets.
The notebook consists of five sequential sections, beginning with library imports and API configuration before retrieving market analysis data, displaying structured tables, and presenting summary information.
What This Project Builds
This notebook builds a lightweight market analysis dashboard capable of retrieving two institutional trading datasets from the Indonesia Stock Exchange API.
The completed workflow includes:
Smart Money Flow retrieval
Bandar Distribution retrieval
RapidAPI integration
JSON response handling
pandas DataFrame transformation
Structured market analysis output
Summary generation
Rather than creating a complex visualization dashboard, the notebook focuses on retrieving, organizing, and presenting institutional trading information in a structured format suitable for further analysis.
CELL 1 — Import Library
import requests
import pandas as pd
from IPython.display import display
Explanation
The notebook begins by importing the libraries required to communicate with the Indonesia Stock Exchange API and organize the returned market analysis data.
The requests library provides the functionality needed to send HTTP requests to the API endpoints. Every interaction with the Indonesia Stock Exchange API throughout the notebook relies on this library to retrieve Smart Money Flow and Bandar Distribution information.
Once the API responses have been received, pandas converts the returned JSON objects into structured DataFrames. Organizing the responses into tabular form makes the information significantly easier to inspect and understand than working directly with nested JSON structures.
The notebook also imports the display function from IPython.display. This function improves notebook readability by rendering pandas DataFrames in a clean tabular format inside Google Colab or Jupyter Notebook.
Unlike larger analytical projects, this notebook intentionally imports only the libraries that are required for retrieving and presenting market analysis data, keeping the overall implementation concise and easy to follow.
CELL 2 — API Configuration
# ================================
# RAPID API
# ================================
API_KEY = "YOUR_API_KEY"

BASE_URL = "https://indonesia-stock-exchange-idx.p.rapidapi.com"

HEADERS = {
    "x-rapidapi-key": API_KEY,
    "x-rapidapi-host": "indonesia-stock-exchange-idx.p.rapidapi.com",
    "Content-Type": "application/json"
}

# ==================================
# Parameter
# ==================================

SMART_TICKER = "BBCA"
DIST_TICKER  = "BUMI"
DAYS = 30
Note: Replace the original API key with
YOUR_API_KEYbefore publishing the notebook or article.
Explanation
The second section prepares the configuration required for communicating with the Indonesia Stock Exchange API through RapidAPI.
The notebook begins by storing the RapidAPI authentication key inside the API_KEY variable. This credential is required whenever requests are sent to the API. Since API keys provide authenticated access to the service, they should never be exposed in publicly shared notebooks or technical articles. Replacing the original key with YOUR_API_KEY is the recommended approach before publication.
Next, the notebook defines the base URL of the Indonesia Stock Exchange API. Keeping the base address inside a dedicated variable simplifies request construction and avoids repeating the same URL throughout the notebook.
The HEADERS dictionary contains the HTTP headers required by RapidAPI. These include the API key, the RapidAPI host identifier, and the content type used for every request. By defining these headers once, the notebook can reuse them whenever different endpoints are accessed.
The final part of this cell specifies the analysis parameters. The notebook retrieves Smart Money Flow information for the BBCA stock symbol and Bandar Distribution information for BUMI. In addition, the DAYS variable limits both analyses to the most recent 30 days, allowing the notebook to focus on recent institutional trading activity instead of processing a larger historical dataset.
These configuration variables provide the foundation for the next section, where the notebook begins requesting data from the Indonesia Stock Exchange API.
CELL 3 — Fetch Smart Money Flow and Bandar Distribution Data
def get_api(endpoint):
    url = BASE_URL + endpoint

    try:
        response = requests.get(
            url,
            headers=HEADERS,
            timeout=30
        )

        print(f"\nEndpoint : {endpoint}")
        print("Status    :", response.status_code)

        if response.status_code == 200:
            return response.json()

        elif response.status_code == 403:
            print("❌ API belum subscribe.")
            return None

        elif response.status_code == 429:
            print("❌ Terlalu banyak request.")
            return None

        else:
            print(response.text)
            return None

    except Exception as e:
        print(e)
        return None


smart_money = get_api(
    f"/api/analysis/bandar/smart-money/{SMART_TICKER}?days={DAYS}"
)

distribution = get_api(
    f"/api/analysis/bandar/distribution/{DIST_TICKER}?days={DAYS}"
)
Explanation
After completing the API configuration, the notebook defines a reusable function named get_api() that handles communication with the Indonesia Stock Exchange API.
Instead of writing separate request logic for every endpoint, the notebook centralizes the process into a single function. This approach keeps the code concise and makes it easier to reuse the same request mechanism whenever additional API endpoints need to be accessed in the future.
The function begins by constructing the complete request URL using the previously defined BASE_URL together with the endpoint passed as an argument. Once the URL has been prepared, an HTTP GET request is sent using the requests library while including the authentication headers configured in the previous cell.
To improve transparency during execution, the notebook prints both the requested endpoint and the returned HTTP status code. These messages allow users to verify which API endpoint is being accessed and quickly identify whether the request was successful.
The function then evaluates the HTTP response returned by the API.
When the server returns HTTP 200, the request is considered successful and the JSON response is immediately returned.
If the API responds with HTTP 403, the notebook informs the user that the RapidAPI account has not subscribed to the required endpoint. This prevents unnecessary debugging by clearly indicating that the issue originates from API access permissions.
Similarly, when HTTP 429 is returned, the notebook reports that too many requests have been sent within a short period. Instead of stopping execution with an exception, the function returns None, allowing the user to recognize that the request limit has been exceeded.
Any unexpected HTTP response is printed directly, while network-related errors are captured by the exception handler to prevent the notebook from terminating unexpectedly.
After defining the helper function, the notebook performs two API requests. The first retrieves Smart Money Flow data for the selected stock ticker stored in SMART_TICKER, while the second retrieves Bandar Distribution information for the stock ticker defined in DIST_TICKER. Both requests use the same helper function, demonstrating how reusable code simplifies interactions with multiple API endpoints.
CELL 4 — Display Smart Money Flow and Bandar Distribution Data
print("="*80)
print("SMART MONEY FLOW")
print("="*80)

if smart_money:

    if isinstance(smart_money, list):
        df_smart = pd.DataFrame(smart_money)

    elif isinstance(smart_money, dict):

        # jika API mengembalikan list pada salah satu key
        for v in smart_money.values():
            if isinstance(v, list):
                df_smart = pd.DataFrame(v)
                break
        else:
            df_smart = pd.DataFrame([smart_money])

    display(df_smart)

else:
    print("Tidak ada data")


print("\n")
print("="*80)
print("BANDAR DISTRIBUTION")
print("="*80)

if distribution:

    if isinstance(distribution, list):
        df_dist = pd.DataFrame(distribution)

    elif isinstance(distribution, dict):

        for v in distribution.values():
            if isinstance(v, list):
                df_dist = pd.DataFrame(v)
                break
        else:
            df_dist = pd.DataFrame([distribution])

    display(df_dist)

else:
    print("Tidak ada data")
Explanation
After retrieving both API responses, the notebook converts the returned JSON objects into structured pandas DataFrames that can be displayed directly inside the notebook.
The first section processes the Smart Money Flow dataset. Because API responses may vary depending on the endpoint, the notebook first checks whether the response is a list or a dictionary. If the response is already a list, it is converted directly into a pandas DataFrame.
When the response is returned as a dictionary, the notebook performs an additional inspection by iterating through every value stored inside the dictionary. If one of those values contains a list, that list is assumed to hold the actual dataset and is converted into a DataFrame. If no list is found, the entire dictionary is wrapped inside a single-row DataFrame. This flexible approach allows the notebook to handle multiple response structures without requiring manual modifications.
Once the DataFrame has been created, the notebook displays the Smart Money Flow data using the display() function, providing a clean and readable tabular representation of the retrieved information.
The second section follows exactly the same workflow for the Bandar Distribution dataset. The notebook again checks whether the response is a list or dictionary, extracts the appropriate data structure, converts it into a DataFrame, and displays the results.
If either API request fails or returns no usable data, the notebook prints a simple notification informing the user that no data is available. This prevents execution errors while clearly communicating the status of each dataset.
By handling multiple response formats automatically, the notebook becomes more robust and adaptable to changes in the API structure. Rather than assuming a fixed JSON format, it dynamically detects the appropriate structure before converting the data into pandas DataFrames, ensuring that both Smart Money Flow and Bandar Distribution information can be displayed consistently.
CELL 5 — Summary
print("="*80)
print("RINGKASAN")
print("="*80)

if smart_money:

    print(f"Ticker Smart Money : {SMART_TICKER}")

    if isinstance(smart_money, dict):
        for k, v in smart_money.items():
            if not isinstance(v, (list, dict)):
                print(f"{k}: {v}")

    print()


if distribution:

    print(f"Ticker Distribution : {DIST_TICKER}")

    if isinstance(distribution, dict):
        for k, v in distribution.items():
            if not isinstance(v, (list, dict)):
                print(f"{k}: {v}")

print("\nSelesai.")
Explanation
The final cell creates a simple summary section for the retrieved Smart Money Flow and Bandar Distribution datasets.
The notebook begins by printing a separator line and the title RINGKASAN, which means summary. This makes the final output easier to distinguish from the previous DataFrame displays.
The first summary section checks whether Smart Money Flow data exists. If the data is available, the notebook prints the selected ticker used for the Smart Money Flow request. In this notebook, the ticker is defined earlier using the SMART_TICKER variable.
The code then checks whether the Smart Money Flow response is a dictionary. If it is, the notebook loops through every key-value pair inside the response. Only values that are not lists or dictionaries are printed. This prevents large nested structures from being printed repeatedly while still displaying important top-level summary information returned by the API.
The same process is then repeated for the Bandar Distribution dataset. If distribution data exists, the notebook prints the ticker defined by DIST_TICKER and displays any simple top-level values returned by the API response.
Finally, the notebook prints Selesai, indicating that the workflow has completed.
This final cell does not perform additional analysis or visualization. Its purpose is to provide a concise text summary after both datasets have been retrieved and displayed.
Result
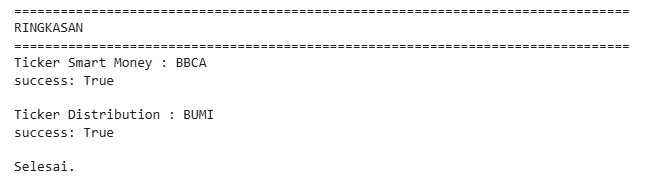
The completed notebook produces two main outputs: Smart Money Flow and Bandar Distribution.
Smart Money Flow Output
The first output displays the Smart Money Flow data retrieved from the Indonesia Stock Exchange API for the ticker defined in SMART_TICKER.
If the API response is available, the notebook converts the response into a pandas DataFrame and displays it in tabular format. The notebook can handle responses returned either as a list or as a dictionary containing a list inside one of its values.
If the API does not return usable data, the notebook prints:
Tidak ada dataThis ensures that the notebook remains readable even when the API request fails or returns an empty response.
Bandar Distribution Output
The second output displays Bandar Distribution data for the ticker defined in DIST_TICKER.
The notebook follows the same response-handling logic used for Smart Money Flow. If the response is a list, it is converted directly into a DataFrame. If the response is a dictionary, the notebook searches for a list inside the dictionary values. If no list is found, it creates a single-row DataFrame from the dictionary itself.
This approach makes the notebook flexible enough to handle different API response structures without breaking the workflow.
Summary Output
The final output prints a text-based summary.
For Smart Money Flow, the notebook displays the selected ticker and any top-level response values that are not nested lists or dictionaries.
For Bandar Distribution, the notebook prints the selected distribution ticker and any simple top-level values returned by the API.
The workflow ends with the message:
Selesai.Overall Workflow
The notebook follows a clear five-step workflow:
Import the required Python libraries.
Configure RapidAPI authentication and analysis parameters.
Request Smart Money Flow and Bandar Distribution data from the Indonesia Stock Exchange API.
Convert the returned API responses into pandas DataFrames.
Display both datasets and print a concise summary.
This workflow keeps the project simple and focused. It retrieves two market analysis datasets, handles different response formats, displays structured outputs, and provides a short final summary.
Why This Project Matters
Smart Money Flow and Bandar Distribution are useful datasets for investors who want to observe institutional-style market activity.
Smart Money Flow helps users review how large market participants may be moving into or out of a stock over a selected period. Bandar Distribution provides another view of market participation by showing distribution-related data for a selected ticker.
By retrieving both datasets through Python, users can automate a process that would otherwise require manual checking. The notebook also provides a reusable structure that can be expanded later with additional tickers, longer time ranges, visualizations, or export functionality.
The project is intentionally lightweight. It does not attempt to predict stock prices or provide investment advice. Instead, it demonstrates how to retrieve, structure, and review market analysis data from the Indonesia Stock Exchange API in a clean and reproducible way.
Conclusion
The Smart Money Flow and Bandar Distribution Dashboard demonstrates how Python can be used to retrieve and display market analysis data from the Indonesia Stock Exchange API.
Using requests, pandas, and display, the notebook connects to RapidAPI, requests Smart Money Flow data for BBCA, retrieves Bandar Distribution data for BUMI, converts the responses into DataFrames, and prints a short summary.
Although simple, this project provides a practical foundation for building more advanced market monitoring dashboards using Indonesia Stock Exchange API data.