
Monitoring broker activity together with upcoming IPO schedules provides a broader view of market conditions. While Top Broker data highlights the brokers with the highest trading activity, the IPO Calendar helps investors keep track of companies preparing to enter the Indonesia Stock Exchange.
Instead of manually checking these datasets from multiple sources, Python can automate the retrieval process using the Indonesia Stock Exchange API. The returned JSON responses can then be transformed into structured DataFrames, analyzed, and summarized in a simple dashboard.
In this tutorial, we build an IDX Top Broker and IPO Calendar Dashboard using Python and the Indonesia Stock Exchange API. The notebook retrieves Top Broker and IPO Calendar data, safely handles API requests, parses nested JSON responses, summarizes broker activity and IPO information, and finishes with a consolidated dashboard.
The notebook consists of five sequential sections covering API configuration, data retrieval, JSON parsing, market analysis, and dashboard generation.
What This Project Builds
This notebook builds a lightweight dashboard for monitoring Top Broker activity and the latest IPO Calendar from the Indonesia Stock Exchange.
The completed workflow includes:
Top Broker retrieval
IPO Calendar retrieval
RapidAPI integration
Retry mechanism for API requests
JSON structure detection
pandas DataFrame conversion
Broker analysis
IPO summary dashboard
Rather than forecasting market performance, the notebook focuses on retrieving, organizing, and presenting market information obtained directly from the Indonesia Stock Exchange API.
CELL 1 — Import & Configuration
import requests
import pandas as pd
import json
import time
from datetime import datetime

# ==========================================================
# KONFIGURASI RAPIDAPI
# ==========================================================

API_KEY = "YOUR_API_KEY"

BASE_URL = "https://indonesia-stock-exchange-idx.p.rapidapi.com"

HEADERS = {
    "Content-Type": "application/json",
    "x-rapidapi-key": API_KEY,
    "x-rapidapi-host": "indonesia-stock-exchange-idx.p.rapidapi.com"
}

pd.set_option("display.max_columns", None)
pd.set_option("display.max_colwidth", 100)
pd.set_option("display.width", 1000)

print("✅ Konfigurasi selesai.")
Note: Replace the original API key with
YOUR_API_KEYbefore publishing the notebook.
Explanation
The notebook begins by importing the Python libraries required throughout the project.
The requests library is used to communicate with the Indonesia Stock Exchange API through RapidAPI. Every API request performed later in the notebook uses this library to retrieve Top Broker and IPO Calendar information.
The notebook imports pandas to organize JSON responses into structured DataFrames. The json library is included for handling JSON objects during debugging, while the time module supports retry delays between API requests. The datetime module is imported to work with date values later in the dashboard.
The second part of the cell prepares the RapidAPI configuration by defining the API key, the API base URL, and the HTTP request headers required for authentication.
Finally, several pandas display options are configured so that large DataFrames remain readable by showing all available columns and using a wider display format.
CELL 2 — Request API
def get_api_data(endpoint, retries=2, timeout=40):
    """
    Mengambil data JSON dari API dengan penanganan error,
    timeout, rate limit, dan percobaan ulang.
    """

    url = BASE_URL + endpoint

    for attempt in range(1, retries + 1):
        try:
            response = requests.get(
                url,
                headers=HEADERS,
                timeout=timeout
            )

            print(f"\nEndpoint : {endpoint}")
            print(f"Status   : {response.status_code}")
            print(f"Percobaan: {attempt}/{retries}")

            if response.status_code == 200:
                try:
                    return response.json()
                except ValueError:
                    print("❌ Respons API bukan JSON yang valid.")
                    print("Respons:", response.text[:500])
                    return None

            elif response.status_code == 401:
                print("❌ API key tidak valid atau belum dimasukkan.")
                return None

            elif response.status_code == 403:
                print("⚠️ Akun RapidAPI belum memiliki akses ke endpoint ini.")
                return None

            elif response.status_code == 429:
                print("⚠️ Rate limit tercapai.")

                if attempt < retries:
                    print("Mencoba kembali...")
                    time.sleep(3)
                    continue

                return None

            else:
                print("❌ Request gagal.")
                print("Respons:", response.text[:500])
                return None

        except requests.exceptions.Timeout:
            print("⚠️ Request mengalami timeout.")

            if attempt < retries:
                print("Mencoba kembali...")
                time.sleep(2)
                continue

            return None

        except requests.exceptions.RequestException as error:
            print("❌ Terjadi kesalahan koneksi:", error)
            return None

    return None


broker_json = get_api_data(
    "/api/market-detector/top-broker"
    "?marketType=MARKET_TYPE_ALL"
    "&period=TB_PERIOD_LAST_1_DAY"
    "&order=ORDER_BY_ASC"
    "&sort=TB_SORT_BY_TOTAL_VALUE"
)

time.sleep(1)

ipo_json = get_api_data(
    "/api/calendar/ipo"
)


print("\n" + "=" * 70)
print("HASIL REQUEST")
print("=" * 70)
print("Top Broker :", "Berhasil" if broker_json is not None else "Gagal")
print("IPO        :", "Berhasil" if ipo_json is not None else "Gagal")
Explanation
The second section retrieves data from two Indonesia Stock Exchange API endpoints.
To avoid duplicating request logic, the notebook defines a reusable helper function named get_api_data(). This function manages HTTP communication while providing built-in handling for invalid responses, authentication errors, request timeouts, and API rate limits.
Each request begins by combining the predefined base URL with the selected endpoint before sending an authenticated HTTP GET request.
During execution, the notebook prints the endpoint, the returned HTTP status code, and the current retry attempt. These messages make it easier to monitor API execution and troubleshoot connection problems.
If the API successfully returns HTTP 200, the function immediately parses and returns the JSON response. Additional validation ensures that invalid JSON responses are detected before the notebook continues.
The function also handles several common API errors. Invalid API keys generate a 401 response, unavailable endpoints return 403, while 429 responses trigger a retry mechanism before the function ultimately returns None if the request still fails.
After defining the helper function, the notebook retrieves Top Broker data using the selected market type, trading period, sorting method, and ordering parameters. A short delay is then introduced before requesting the IPO Calendar endpoint to reduce the chance of triggering the API rate limit.
Finally, the notebook prints a concise summary indicating whether each API request completed successfully before continuing to the data processing stage.
CELL 3 — Read JSON Structure and Create DataFrames
def find_record_list(data):
    """
    Mencari list berisi record dari struktur JSON bertingkat.

    Mendukung format seperti:
    {
        "success": true,
        "data": [...]
    }

    atau:
    {
        "success": true,
        "data": {
            "items": [...]
        }
    }
    """

    if data is None:
        return []

    if isinstance(data, list):
        return data

    if not isinstance(data, dict):
        return []

    preferred_keys = [
        "data",
        "items",
        "results",
        "result",
        "records",
        "content",
        "brokers",
        "topBrokers",
        "top_brokers",
        "ipo",
        "ipos",
        "calendar",
        "list"
    ]

    for key in preferred_keys:
        if key in data:
            value = data[key]

            if isinstance(value, list):
                return value

            if isinstance(value, dict):
                nested_result = find_record_list(value)

                if nested_result:
                    return nested_result

    for value in data.values():
        if isinstance(value, list) and len(value) > 0:
            if isinstance(value[0], dict):
                return value

        if isinstance(value, dict):
            nested_result = find_record_list(value)

            if nested_result:
                return nested_result

    ignored_keys = {
        "success",
        "status",
        "message",
        "timestamp",
        "code",
        "error"
    }

    record = {
        key: value
        for key, value in data.items()
        if key not in ignored_keys
    }

    if record:
        return [record]

    return []


broker_records = find_record_list(broker_json)
ipo_records = find_record_list(ipo_json)

broker_df = pd.json_normalize(broker_records)
ipo_df = pd.json_normalize(ipo_records)


print("=" * 80)
print("DATA TOP BROKER")
print("=" * 80)

if broker_df.empty:
    print("Tidak ada data Top Broker.")
else:
    display(broker_df)
    print("Jumlah baris :", len(broker_df))
    print("Nama kolom  :", broker_df.columns.tolist())


print("\n" + "=" * 80)
print("DATA IPO CALENDAR")
print("=" * 80)

if ipo_df.empty:
    print("Tidak ada data IPO.")
else:
    display(ipo_df)
    print("Jumlah baris :", len(ipo_df))
    print("Nama kolom  :", ipo_df.columns.tolist())
Explanation
After retrieving the API responses, the notebook converts the returned JSON objects into structured pandas DataFrames.
Because the Indonesia Stock Exchange API may return different JSON structures across endpoints, the notebook first defines a helper function named find_record_list(). This function is responsible for locating the actual list of records regardless of how deeply the data is nested inside the response.
The function begins by checking whether the response is already a list. If so, that list is returned immediately. When the response is a dictionary, the function searches several commonly used keys such as data, items, results, records, content, brokers, ipo, and calendar. If one of these keys contains another dictionary, the function continues searching recursively until it finds the list containing the actual records.
When no predefined key matches, the function performs a recursive search across every value stored inside the JSON object. This additional step makes the notebook more resilient because it can still extract records even when the response structure changes slightly.
If the response represents a single record instead of a collection, the notebook removes metadata fields such as success, status, message, timestamp, and error, then converts the remaining values into a one-row dataset.
After the records have been extracted, the notebook converts both datasets into pandas DataFrames using pd.json_normalize(). The resulting DataFrames are stored inside broker_df and ipo_df.
Finally, the notebook displays both DataFrames. When data is available, it prints the complete table together with the number of rows and the detected column names. If no records are found, the notebook informs the user that no Top Broker or IPO Calendar data is available.
This flexible parsing approach allows the notebook to work with multiple API response formats while keeping the remaining analysis independent of the underlying JSON structure.
CELL 4 — Clean Data and Display Analysis
def find_column(df, candidates):
    """
    Mencari kolom berdasarkan beberapa kemungkinan nama.
    Pencarian tidak membedakan huruf besar dan kecil.
    """

    if df.empty:
        return None

    column_mapping = {
        str(column).lower().replace("_", "").replace(".", ""): column
        for column in df.columns
    }

    for candidate in candidates:
        normalized = candidate.lower().replace("_", "").replace(".", "")

        if normalized in column_mapping:
            return column_mapping[normalized]

    for candidate in candidates:
        normalized_candidate = (
            candidate.lower()
            .replace("_", "")
            .replace(".", "")
        )

        for normalized_column, original_column in column_mapping.items():
            if normalized_candidate in normalized_column:
                return original_column

    return None


def safe_number(value):

    if value is None:
        return 0

    if isinstance(value, (int, float)):
        return value

    text = str(value).strip()

    if text in ["", "-", "None", "null", "nan"]:
        return 0

    text = (
        text.replace("Rp", "")
        .replace("IDR", "")
        .replace(",", "")
        .replace(" ", "")
    )

    try:
        return float(text)
    except ValueError:
        return 0


def format_rupiah(value):
    return f"Rp {safe_number(value):,.0f}"
(Cell ini kemudian melanjutkan proses pendeteksian kolom Top Broker dan IPO, lalu menampilkan RINGKASAN TOP BROKER serta RINGKASAN IPO CALENDAR persis seperti yang terdapat pada notebook.)
Explanation
The fourth section prepares the datasets before generating a readable market summary.
Because column names returned by the API may differ between responses, the notebook first defines the find_column() helper function. Instead of relying on a single column name, this function searches several possible alternatives while ignoring differences in capitalization, underscores, and punctuation. This makes the notebook considerably more robust when working with evolving API schemas.
The notebook then defines safe_number(), which safely converts different value formats into numeric values. Empty strings, missing values, currency symbols, commas, and other non-numeric characters are removed before conversion. If conversion fails, the function simply returns zero instead of generating an exception.
The format_rupiah() helper function formats numeric values into Indonesian Rupiah, making transaction values easier to read in the final output.
After preparing these helper functions, the notebook automatically detects the most appropriate columns for the Top Broker dataset, including broker code, broker name, buy value, sell value, total transaction value, and transaction frequency. The same detection process is then applied to the IPO Calendar dataset to identify the stock symbol, company name, offering price, and listing date.
Using the detected columns, the notebook generates two summaries. The Top Broker section displays the first ten brokers together with their available transaction values and trading frequency. The IPO Calendar section displays the first twenty IPO entries, including the company name, offering price, and listing date whenever those fields are available.
Rather than depending on fixed column names, this adaptive approach allows the notebook to continue working even if the API slightly changes the naming convention of returned fields.
CELL 5 — Final Dashboard
def clean_text(value, default="-"):
    """
    Membersihkan nilai teks kosong, None, dan NaN.
    """

    if value is None:
        return default

    try:
        if pd.isna(value):
            return default
    except (TypeError, ValueError):
        pass

    text = str(value).strip()

    if text.lower() in ["", "none", "null", "nan"]:
        return default

    return text


print("=" * 80)
print("IDX MARKET DASHBOARD")
print("=" * 80)

print(f"\nJumlah Broker : {len(broker_df)}")
print(f"Jumlah IPO    : {len(ipo_df)}")


# ==========================================================
# TOTAL NILAI TRANSAKSI BROKER
# ==========================================================

if not broker_df.empty and total_value_col:

    total_broker_value = broker_df[total_value_col].apply(
        safe_number
    ).sum()

    print(
        "\nTotal Nilai Transaksi Broker :",
        format_rupiah(total_broker_value)
    )

elif not broker_df.empty and buy_value_col and sell_value_col:

    total_buy = broker_df[buy_value_col].apply(
        safe_number
    ).sum()

    total_sell = broker_df[sell_value_col].apply(
        safe_number
    ).sum()

    total_broker_value = total_buy + total_sell

    print(
        "\nTotal Nilai Buy + Sell Broker:",
        format_rupiah(total_broker_value)
    )

else:
    print("\nTotal Nilai Broker : Kolom nilai tidak ditemukan")


# ==========================================================
# BROKER DENGAN NILAI TRANSAKSI TERTINGGI
# ==========================================================

if not broker_df.empty and total_value_col:

    broker_dashboard = broker_df.copy()

    broker_dashboard["_numeric_total_value"] = (
        broker_dashboard[total_value_col].apply(safe_number)
    )

    top_broker = broker_dashboard.sort_values(
        "_numeric_total_value",
        ascending=False
    ).iloc[0]

    top_code = (
        clean_text(top_broker.get(broker_code_col))
        if broker_code_col else "-"
    )

    top_name = (
        clean_text(top_broker.get(broker_name_col))
        if broker_name_col else "-"
    )

    top_value = top_broker["_numeric_total_value"]

    print("\nTop Broker:")
    print(f"Kode  : {top_code}")
    print(f"Nama  : {top_name}")
    print(f"Nilai : {format_rupiah(top_value)}")


# ==========================================================
# IPO TERDEKAT
# ==========================================================

if not ipo_df.empty:

    ipo_dashboard = ipo_df.copy()

    if ipo_listing_col:

        ipo_dashboard["_listing_datetime"] = pd.to_datetime(
            ipo_dashboard[ipo_listing_col],
            errors="coerce",
            utc=True
        )

        valid_dates = ipo_dashboard[
            ipo_dashboard["_listing_datetime"].notna()
        ].copy()

        if not valid_dates.empty:

            current_time = pd.Timestamp.now(tz="UTC")

            future_ipo = valid_dates[
                valid_dates["_listing_datetime"] >= current_time
            ].copy()

            if not future_ipo.empty:
                selected_ipo = future_ipo.sort_values(
                    "_listing_datetime"
                ).iloc[0]
            else:
                selected_ipo = valid_dates.sort_values(
                    "_listing_datetime",
                    ascending=False
                ).iloc[0]

        else:
            selected_ipo = ipo_dashboard.iloc[0]

    else:
        selected_ipo = ipo_dashboard.iloc[0]

    ipo_symbol = (
        clean_text(selected_ipo.get(ipo_symbol_col))
        if ipo_symbol_col else "-"
    )

    ipo_company = (
        clean_text(selected_ipo.get(ipo_company_col))
        if ipo_company_col else "-"
    )

    ipo_listing = (
        clean_text(selected_ipo.get(ipo_listing_col))
        if ipo_listing_col else "-"
    )

    ipo_price = (
        clean_text(selected_ipo.get(ipo_price_col))
        if ipo_price_col else "-"
    )

    print("\nIPO Terdekat:")
    print(f"Kode       : {ipo_symbol}")
    print(f"Perusahaan : {ipo_company}")
    print(f"Harga      : {ipo_price}")
    print(f"Listing    : {ipo_listing}")

else:
    print("\nIPO Terdekat: Tidak ada data IPO")


# ==========================================================
# INFORMASI KOLOM YANG TERDETEKSI
# ==========================================================

print("\n" + "-" * 80)
print("KOLOM YANG TERDETEKSI")
print("-" * 80)

print("Broker Code :", broker_code_col)
print("Broker Name :", broker_name_col)
print("Buy Value   :", buy_value_col)
print("Sell Value  :", sell_value_col)
print("Total Value :", total_value_col)
print("IPO Symbol  :", ipo_symbol_col)
print("IPO Company :", ipo_company_col)
print("IPO Price   :", ipo_price_col)
print("IPO Listing :", ipo_listing_col)

print("\n" + "=" * 80)
print("SELESAI")
print("=" * 80)
Explanation
The final cell combines the processed Top Broker and IPO Calendar datasets into a concise IDX Market Dashboard.
The cell begins by defining clean_text(), a helper function that handles empty text values, None, and NaN. If a value is missing or invalid, the function returns a default dash. This prevents empty or unreadable values from appearing in the final dashboard.
The dashboard then prints the total number of broker records and IPO records available in broker_df and ipo_df.
Calculating Total Broker Transaction Value
The first analysis calculates the total transaction value across all brokers.
When a total-value column has been detected, the notebook converts each entry into a safe numeric value and sums the complete column. The result is then formatted as Indonesian Rupiah using format_rupiah().
If no total-value column is available but buy and sell columns exist, the notebook calculates the total buy value and total sell value separately before adding them together.
When none of the required value columns can be identified, the dashboard reports that the transaction-value column was not found.
Identifying the Top Broker
The notebook next identifies the broker with the highest transaction value.
A copy of the broker DataFrame is created, and the detected transaction-value column is converted into a numeric helper column. The data is then sorted from the largest value to the smallest, and the first row is selected as the top broker.
The dashboard displays the broker code, broker name, and total transaction value. Missing text fields are handled by clean_text() so the output remains readable.
Selecting the Nearest IPO
The IPO section attempts to identify the nearest listing date.
When a listing-date column is available, its values are converted into UTC datetime objects. Invalid dates are removed, and the notebook compares the remaining dates with the current UTC time.
If future IPO dates are available, the earliest upcoming listing is selected. If all listing dates have passed, the latest valid historical listing is used instead. When no valid date column exists, the notebook defaults to the first IPO record.
The dashboard then displays the selected IPO’s symbol, company name, offering price, and listing date.
Displaying Detected Columns
The final section reports every column detected during the earlier analysis. This includes the columns used for broker code, broker name, buy value, sell value, total value, IPO symbol, company name, price, and listing date.
This diagnostic output is useful because API field names can change. By printing the detected columns, users can immediately verify whether the notebook matched the correct fields.
The cell ends by printing SELESAI, confirming that the dashboard workflow has completed.
Result
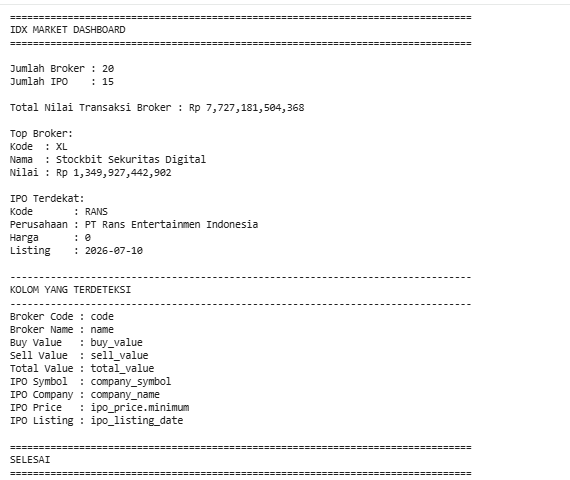
The completed notebook produces an IDX Top Broker and IPO Calendar Dashboard containing several structured outputs.
Top Broker Data
The notebook displays the complete Top Broker DataFrame, including the number of rows and detected column names.
It then prints a readable summary of the first ten brokers. Depending on the columns returned by the API, the summary may include:
Broker code
Broker name
Buy value
Sell value
Total transaction value
Transaction frequency
The final dashboard also calculates the combined broker transaction value and identifies the broker with the highest total value.
IPO Calendar Data
The IPO Calendar response is converted into a pandas DataFrame and displayed together with its row count and available columns.
The notebook then summarizes up to twenty IPO records, including the stock symbol, company name, offering price, and listing date whenever those fields are available.
In the final dashboard, the notebook selects the nearest upcoming IPO based on its listing date. If no future listing is found, it uses the most recent valid listing record.
Final Dashboard Output
The dashboard presents:
Total number of brokersTotal number of IPO records
Total broker transaction value
Highest-value broker
Nearest IPO listing
All detected broker and IPO columns
This creates a concise final overview without requiring users to inspect every DataFrame manually.
Overall Workflow
The notebook follows this workflow:
Import Python libraries and configure RapidAPI access.
Request Top Broker data with retry and error handling.
Pause briefly before requesting the IPO Calendar.
Search nested JSON responses for usable record lists.
Convert Top Broker and IPO records into pandas DataFrames.
Detect important columns automatically.
Convert transaction values into safe numeric values.
Display Top Broker and IPO summaries.
Calculate total broker transaction value.
Identify the broker with the highest transaction value.
Select the nearest IPO based on listing date.
Display the final IDX Market Dashboard.
Why This Project Matters
Top Broker activity and IPO schedules provide two different perspectives on the Indonesian stock market.
Top Broker data helps users observe which brokers record the highest transaction activity. The IPO Calendar provides information about companies entering the public market, including their offering prices and listing schedules.
The notebook is also designed to handle inconsistent API responses. Its recursive JSON search, dynamic column detection, safe number conversion, retry handling, and text-cleaning functions make it more resilient than a workflow that depends on fixed response structures.
By combining both datasets, the project creates a practical dashboard for monitoring broker transactions and upcoming IPO activity in one notebook.
Conclusion
The IDX Top Broker and IPO Calendar Dashboard demonstrates how Python can be used to retrieve, process, analyze, and summarize market data from the Indonesia Stock Exchange API.
Using requests and pandas, the notebook handles API authentication, retries failed requests, extracts records from nested JSON responses, detects varying column names, calculates broker transaction values, identifies the top broker, and selects the nearest IPO listing.
The result is a structured IDX market dashboard that provides broker activity and IPO information in a clear and reusable Python workflow.