
Corporate actions and commodity price movements are two important sources of information for market participants. A company's General Meeting of Shareholders (RUPS) provides insight into upcoming corporate decisions, while commodity price changes can influence the performance of companies operating in commodity-related sectors.
Instead of monitoring these datasets separately, Python allows both information sources to be retrieved automatically through the Indonesia Stock Exchange API. After collecting the responses, the data can be normalized, analyzed, and summarized into a single dashboard for easier monitoring.
In this tutorial, we build an IDX RUPS Calendar and Commodities Impact Dashboard using Python and the Indonesia Stock Exchange API. The notebook retrieves RUPS Calendar and Commodities Impact data, processes different API response structures, evaluates commodity impacts, and produces a concise dashboard summarizing both corporate schedules and commodity conditions.
The notebook is organized into five sections covering API configuration, data retrieval, response normalization, data presentation, and dashboard analysis.
What This Project Builds
This notebook builds a lightweight dashboard for monitoring RUPS schedules together with commodity market impacts.
The completed workflow includes:
RUPS Calendar retrieval
Commodities Impact retrieval
RapidAPI integration
Response normalization
JSON processing
pandas DataFrame conversion
Commodity impact analysis
Market dashboard summary
Rather than predicting market prices, the notebook focuses on retrieving, organizing, and summarizing market information published by the Indonesia Stock Exchange API.
CELL 1 — Import Library & API Configuration
# ==========================================================
# CELL 1 — IMPORT & KONFIGURASI
# ==========================================================

import requests
import pandas as pd
from datetime import datetime

API_KEY = "YOUR_API_KEY"

BASE_URL = "https://indonesia-stock-exchange-idx.p.rapidapi.com"

headers = {
    "x-rapidapi-key": API_KEY,
    "x-rapidapi-host": "indonesia-stock-exchange-idx.p.rapidapi.com",
    "Content-Type": "application/json"
}

print("="*70)
print("IDX DASHBOARD")
print("RUPS CALENDAR + COMMODITIES IMPACT")
print("="*70)
print("Tanggal :", datetime.now().strftime("%d %B %Y %H:%M"))
Note: Replace the original API key with
YOUR_API_KEYbefore publishing the notebook publicly.
Explanation
The notebook begins by importing the Python libraries required throughout the project.
The requests library is used to communicate with the Indonesia Stock Exchange API through RapidAPI. Every request performed later in the notebook relies on this library to retrieve RUPS Calendar and Commodities Impact information.
The notebook also imports pandas to organize API responses into structured tables whenever needed. The datetime module is imported to display the current execution time on the dashboard header.
The second part of the cell prepares the API configuration by defining the API key, the API base URL, and the HTTP request headers required for authentication.
Finally, the notebook prints a dashboard header together with the current execution date and time. This provides immediate confirmation that the notebook configuration has completed successfully before any API requests are sent.
CELL 2 — Request API
# ==========================================================
# CELL 2 — REQUEST API
# ==========================================================

def get_data(endpoint):

    url = BASE_URL + endpoint

    try:
        r = requests.get(url, headers=headers, timeout=30)

        print(f"\nEndpoint : {endpoint}")
        print("Status   :", r.status_code)

        if r.status_code == 200:
            return r.json()

        elif r.status_code == 429:
            print("⚠️ Rate Limit.")
            return None

        elif r.status_code == 403:
            print("⚠️ API Belum Subscribe.")
            return None

        else:
            print("Error :", r.text)
            return None

    except Exception as e:
        print("❌ Error :", e)
        return None


rups_json = get_data("/api/calendar/rups")

commodity_json = get_data("/api/main/commodities-impact")


print("\n==============================")
print("DEBUG")
print("==============================")

print("RUPS       :", type(rups_json).__name__)
print("Commodity  :", type(commodity_json).__name__)
Explanation
The second section retrieves data from two Indonesia Stock Exchange API endpoints.
The notebook defines a reusable helper function named get_data(). Instead of repeating the same request logic for every endpoint, this function centralizes the communication process into a single reusable component.
Each request starts by combining the predefined BASE_URL with the selected endpoint before sending an authenticated HTTP GET request.
During execution, the notebook prints both the requested endpoint and the returned HTTP status code. These messages allow users to verify whether each request completed successfully or encountered an API-related issue.
The helper function handles several common HTTP responses. A successful request (HTTP 200) returns the parsed JSON response immediately. If the API returns HTTP 429, indicating that the request limit has been exceeded, the notebook reports a rate-limit warning and returns None. If the endpoint requires a subscription (HTTP 403), the notebook informs the user that access is unavailable.
Any unexpected responses or connection errors are printed before the function safely returns None, allowing the notebook to continue running without interruption.
After defining the helper function, the notebook requests RUPS Calendar data followed by Commodities Impact data. Finally, it prints the Python data types of both API responses as a simple debugging step before continuing to the normalization process.
CELL 3 — Data Normalization
# ==========================================================
# CELL 3 — NORMALISASI DATA
# ==========================================================

def normalize(obj):

    if obj is None:
        return []

    if isinstance(obj, dict):

        if "data" in obj:
            return obj["data"]

        return [obj]

    elif isinstance(obj, list):
        return obj

    return []


rups = normalize(rups_json)
commodity = normalize(commodity_json)

print("="*70)
print("HASIL NORMALISASI")
print("="*70)

print("Jumlah RUPS        :", len(rups))
print("Commodity Records  :", len(commodity))
Explanation
After retrieving both API responses, the notebook standardizes their structure before displaying or analyzing the data.
To achieve this, the notebook defines a helper function named normalize(). The function is designed to handle several possible response formats returned by the Indonesia Stock Exchange API.
If the API response is None, the function immediately returns an empty list, allowing the remaining notebook to continue safely without raising exceptions.
When the response is a dictionary, the function checks whether a data field exists. If present, the contents of that field are returned because it typically contains the main records retrieved from the endpoint. If the dictionary does not contain a data field, the entire dictionary is wrapped inside a list so it can still be processed consistently.
If the response is already a list, it is returned directly without modification.
Any unsupported response type is converted into an empty list.
The normalized RUPS Calendar data is stored inside the rups variable, while the normalized Commodities Impact data is stored inside the commodity variable.
Finally, the notebook prints a simple normalization summary showing the number of RUPS schedules and Commodity records successfully extracted from both API responses.
This normalization step provides a consistent data structure for the remaining cells regardless of how the original API response is formatted.
CELL 4 — Display Data
# ==========================================================
# CELL 4 — TAMPILKAN DATA
# ==========================================================

print("="*90)
print("RUPS CALENDAR")
print("="*90)

if len(rups)==0:

    print("Tidak ada data RUPS.")

else:

    df = pd.json_normalize(rups)

    cols = []

    for c in [
        "stockCode",
        "companyName",
        "meetingDate",
        "agenda",
        "location"
    ]:
        if c in df.columns:
            cols.append(c)

    if cols:
        display(df[cols].head(20))
    else:
        display(df.head())


print("\n")
print("="*90)
print("COMMODITIES IMPACT")
print("="*90)

if len(commodity)==0:

    print("Tidak ada data Commodity Impact.")

else:

    df2 = pd.json_normalize(commodity)

    important=[]

    for c in [
        "commodity",
        "price",
        "change",
        "changePercent",
        "impact",
        "beneficiarySector",
        "affectedSector",
        "summary"
    ]:

        if c in df2.columns:
            important.append(c)

    if important:
        display(df2[important])
    else:
        display(df2)
Explanation
Once both datasets have been normalized, the notebook converts them into pandas DataFrames for easier inspection.
The first section focuses on the RUPS Calendar dataset.
If no RUPS records are available, the notebook informs the user that there is no RUPS data to display. Otherwise, the normalized records are converted into a DataFrame using pd.json_normalize().
Rather than displaying every available field, the notebook searches for several important columns, including stock code, company name, meeting date, meeting agenda, and meeting location. Only the columns that actually exist in the response are selected. This flexible approach prevents errors when certain fields are absent while keeping the output concise.
If none of the expected columns are found, the notebook displays the complete DataFrame instead.
The second section applies the same workflow to the Commodities Impact dataset.
When commodity data is available, the notebook converts the records into another DataFrame and searches for several key fields, including commodity name, price, price change, percentage change, market impact, beneficiary sector, affected sector, and summary.
If one or more of these fields are present, only those columns are displayed. Otherwise, the notebook presents the full DataFrame.
This adaptive column-selection strategy allows the notebook to remain compatible with different API response structures while highlighting the most relevant information whenever possible.
CELL 5 — Dashboard Summary
# ==========================================================
# CELL 5 — DASHBOARD RINGKASAN
# ==========================================================

print("=" * 90)
print("IDX MARKET DASHBOARD")
print("=" * 90)


# ==========================================================
# FUNGSI BANTU
# ==========================================================

def safe_text(value, default="-"):
    """Mengubah nilai menjadi teks secara aman."""

    if value is None:
        return default

    if isinstance(value, (list, dict)):
        return str(value)

    value = str(value).strip()

    return value if value else default


def find_value(data, possible_keys, default="-"):
    """
    Mencari nilai berdasarkan beberapa kemungkinan nama key,
    termasuk key yang berada di dalam nested dictionary.
    """

    if not isinstance(data, dict):
        return default

    # Cari langsung
    for key in possible_keys:
        if key in data and data[key] not in [None, "", [], {}]:
            return data[key]

    # Cari pada nested dictionary
    for value in data.values():
        if isinstance(value, dict):
            result = find_value(value, possible_keys, None)

            if result not in [None, "", [], {}]:
                return result

    return default


def convert_to_records(data):
    """
    Mengubah berbagai bentuk respons menjadi list berisi dictionary.
    """

    if data is None:
        return []

    if isinstance(data, list):
        return [item for item in data if isinstance(item, dict)]

    if isinstance(data, dict):

        # Kemungkinan data tersimpan pada key tertentu
        for key in [
            "data",
            "commodities",
            "commodity",
            "items",
            "results",
            "records",
            "impact",
            "impacts"
        ]:
            value = data.get(key)

            if isinstance(value, list):
                return [
                    item for item in value
                    if isinstance(item, dict)
                ]

            if isinstance(value, dict):
                nested_records = convert_to_records(value)

                if nested_records:
                    return nested_records

        # Jika dictionary merupakan satu record
        scalar_values = [
            value for value in data.values()
            if not isinstance(value, (dict, list))
        ]

        if scalar_values:
            return [data]

        # Jika dictionary berisi beberapa commodity sebagai key
        records = []

        for key, value in data.items():

            if isinstance(value, dict):
                item = value.copy()

                if not any(
                    commodity_key in item
                    for commodity_key in [
                        "commodity",
                        "name",
                        "symbol",
                        "commodityName"
                    ]
                ):
                    item["commodity"] = key

                records.append(item)

        return records

    return []


# ==========================================================
# NORMALISASI ULANG DATA UNTUK DASHBOARD
# ==========================================================

rups_records = convert_to_records(rups)
commodity_records = convert_to_records(commodity)


# ==========================================================
# RUPS CALENDAR
# ==========================================================

print("\n📅 RUPS CALENDAR")
print("-" * 90)

if rups_records:

    print("Jumlah Jadwal RUPS :", len(rups_records))

    first_rups = rups_records[0]

    kode = find_value(
        first_rups,
        [
            "stockCode",
            "stock_code",
            "symbol",
            "ticker",
            "code"
        ]
    )

    perusahaan = find_value(
        first_rups,
        [
            "companyName",
            "company_name",
            "company",
            "issuerName",
            "name"
        ]
    )

    tanggal = find_value(
        first_rups,
        [
            "meetingDate",
            "meeting_date",
            "date",
            "rupsDate",
            "eventDate"
        ]
    )

    print("RUPS Terdekat       :", safe_text(kode))
    print("Perusahaan          :", safe_text(perusahaan))
    print("Tanggal             :", safe_text(tanggal))

else:
    print("Belum ada jadwal RUPS.")


# ==========================================================
# COMMODITIES IMPACT
# ==========================================================

print("\n🛢️ COMMODITIES IMPACT")
print("-" * 90)

if commodity_records:

    print("Jumlah Commodity :", len(commodity_records))

    positive = 0
    negative = 0
    neutral = 0

    highest_change = None
    highest_item = None

    for item in commodity_records:

        if not isinstance(item, dict):
            continue

        impact_value = find_value(
            item,
            [
                "impact",
                "sentiment",
                "status",
                "signal",
                "direction",
                "outlook"
            ],
            default=""
        )

        impact_text = str(impact_value).upper()

        if any(word in impact_text for word in [
            "POSITIVE",
            "POSITIF",
            "BULLISH",
            "BENEFIT",
            "NAIK"
        ]):
            positive += 1

        elif any(word in impact_text for word in [
            "NEGATIVE",
            "NEGATIF",
            "BEARISH",
            "RISK",
            "TURUN"
        ]):
            negative += 1

        else:
            neutral += 1

        change_value = find_value(
            item,
            [
                "changePercent",
                "change_percent",
                "percentageChange",
                "percentChange",
                "change"
            ],
            default=None
        )

        try:
            numeric_change = float(
                str(change_value)
                .replace("%", "")
                .replace(",", ".")
            )

            if (
                highest_change is None
                or abs(numeric_change) > abs(highest_change)
            ):
                highest_change = numeric_change
                highest_item = item

        except (TypeError, ValueError):
            pass

    print("Impact Positif   :", positive)
    print("Impact Negatif   :", negative)
    print("Impact Netral    :", neutral)

    if highest_item:

        commodity_name = find_value(
            highest_item,
            [
                "commodity",
                "commodityName",
                "name",
                "symbol"
            ]
        )

        print(
            "Perubahan Terbesar:",
            f"{safe_text(commodity_name)} ({highest_change:+.2f}%)"
        )

    print("\nRingkasan Commodity:")

    for index, item in enumerate(
        commodity_records[:5],
        start=1
    ):

        commodity_name = find_value(
            item,
            [
                "commodity",
                "commodityName",
                "name",
                "symbol"
            ]
        )

        price = find_value(
            item,
            [
                "price",
                "currentPrice",
                "current_price",
                "value"
            ]
        )

        change = find_value(
            item,
            [
                "changePercent",
                "change_percent",
                "percentageChange",
                "percentChange",
                "change"
            ]
        )

        impact = find_value(
            item,
            [
                "impact",
                "sentiment",
                "status",
                "signal",
                "direction"
            ]
        )

        print(
            f"{index}. {safe_text(commodity_name)} | "
            f"Harga: {safe_text(price)} | "
            f"Perubahan: {safe_text(change)} | "
            f"Impact: {safe_text(impact)}"
        )

else:
    print("Belum ada data Commodity Impact.")


# ==========================================================
# KESIMPULAN
# ==========================================================

print("\n" + "=" * 90)
print("KESIMPULAN")
print("=" * 90)

if not rups_records and not commodity_records:

    print("❌ Tidak ada data yang berhasil diperoleh dari kedua endpoint.")

elif rups_records and commodity_records:

    print("✅ Jadwal RUPS berhasil dimuat.")
    print("✅ Data dampak komoditas berhasil dimuat.")
    print(
        "Dashboard dapat digunakan untuk melihat jadwal aksi korporasi "
        "dan kondisi komoditas yang berpotensi memengaruhi saham terkait."
    )

elif rups_records:

    print("✅ Data RUPS berhasil dimuat.")
    print("⚠️ Data Commodities Impact belum tersedia.")

else:

    print("⚠️ Data RUPS belum tersedia.")
    print("✅ Data Commodities Impact berhasil dimuat.")


# ==========================================================
# DEBUG STRUKTUR
# ==========================================================

print("\n" + "-" * 90)
print("DEBUG STRUKTUR DATA")
print("-" * 90)

print("RUPS Type              :", type(rups).__name__)
print("RUPS Records           :", len(rups_records))
print("Commodity Type         :", type(commodity).__name__)
print("Commodity Records      :", len(commodity_records))

if commodity_records:
    print(
        "Commodity Keys Pertama:",
        list(commodity_records[0].keys())
    )
Explanation
The final cell creates the complete IDX RUPS Calendar and Commodities Impact Dashboard.
It begins with three helper functions designed to make the dashboard compatible with different API response structures.
The safe_text() function converts values into readable text. Missing or empty values are replaced with a dash, while lists and dictionaries are converted into strings so they can still be printed safely.
The find_value() function searches for a value using several possible key names. It first checks the current dictionary, then recursively searches nested dictionaries. This allows the dashboard to find fields even when the API changes naming conventions or places values inside nested objects.
The convert_to_records() function converts different response formats into a consistent list of dictionaries. It supports direct lists, dictionaries containing common record keys, nested response structures, single-record dictionaries, and dictionaries where commodity names are used as keys.
After applying this function, the notebook stores the normalized results inside rups_records and commodity_records.
RUPS Calendar Summary
The RUPS section prints the total number of schedules found.
The notebook selects the first RUPS record and searches for several possible field names representing:
stock code,
company name,
meeting date.
The values are then displayed as the nearest RUPS record. If no records exist, the dashboard prints that no RUPS schedule is currently available.
Commodities Impact Analysis
The Commodities Impact section begins by displaying the number of commodity records.
The notebook then classifies each record into positive, negative, or neutral impact. It searches possible fields such as impact, sentiment, status, signal, direction, and outlook.
Positive classifications include terms such as POSITIVE, BULLISH, BENEFIT, and NAIK. Negative classifications include NEGATIVE, BEARISH, RISK, and TURUN. Records without matching terms are counted as neutral.
The notebook also searches for the commodity with the largest absolute percentage change. Values containing percentage signs are cleaned before numeric conversion. The record with the largest positive or negative movement is then displayed.
Finally, the first five commodity records are summarized using commodity name, price, percentage change, and impact.
Dashboard Conclusion
The conclusion depends on which datasets are available.
If both datasets are empty, the notebook reports that neither endpoint returned data. If both are available, it confirms that the RUPS schedule and commodity impact information were loaded successfully. It also supports partial results when only one endpoint returns usable data.
Debug Information
The final output displays the data types and record counts for both datasets. When commodity records exist, the notebook also prints the keys available in the first commodity record.
This helps users inspect the API response structure and troubleshoot missing fields without examining the complete raw JSON response.
Result
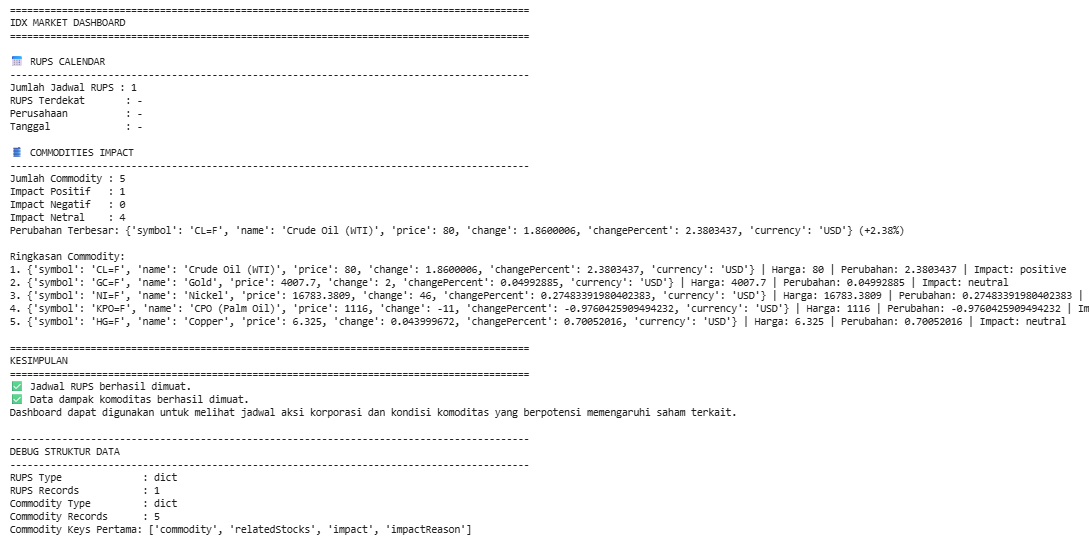
The notebook produces three primary outputs: RUPS Calendar, Commodities Impact, and a final IDX Market Dashboard.
RUPS Calendar Output
The notebook retrieves RUPS data from:
/api/calendar/rupsAfter normalization, the records are converted into a pandas DataFrame.
When expected fields are available, the table displays:
stock code,
company name,
meeting date,
agenda,
location.
The final dashboard also displays the number of RUPS schedules and details from the first available record.
If no RUPS data is returned, the notebook displays:
Belum ada jadwal RUPS.Commodities Impact Output
The Commodities Impact response is retrieved from:
/api/main/commodities-impactThe notebook displays important fields when available, including:
commodity,
price,
change,
percentage change,
impact,
beneficiary sector,
affected sector,
summary.
The final dashboard classifies each commodity impact as positive, negative, or neutral. It also identifies the commodity with the largest absolute price movement and prints a concise summary of up to five records.
Final Market Dashboard
The dashboard provides:
total RUPS schedules,
nearest RUPS information,
total commodity records,
positive impact count,
negative impact count,
neutral impact count,
largest commodity movement,
up to five commodity summaries,
endpoint availability conclusion,
response structure debugging.
Overall Workflow
The notebook follows this workflow:
Import the required Python libraries.
Configure RapidAPI authentication.
Request RUPS Calendar data.
Request Commodities Impact data.
Print response types for debugging.
Normalize both API responses.
Convert the normalized data into pandas DataFrames.
Select important RUPS and commodity columns.
Normalize the responses again for the final dashboard.
Find the nearest available RUPS record.
Classify commodity impacts as positive, negative, or neutral.
Identify the largest commodity percentage change.
Print up to five commodity summaries.
Generate a conclusion based on endpoint availability.
Display response types, record counts, and commodity keys.
Why This Project Matters
RUPS schedules and commodity movements represent two different sources of market information.
RUPS Calendar data helps investors monitor corporate meetings where important decisions may be discussed. Commodities Impact data provides context about commodity price changes and their potential effects on related sectors or companies.
The notebook combines both datasets into one workflow while handling inconsistent JSON structures. Its recursive field search and flexible record conversion make it more reliable than a solution that depends on one fixed response format.
The dashboard remains focused on data retrieval and presentation. It does not add price predictions, trading signals, or recommendations beyond the impact labels already returned by the API.
Conclusion
The IDX RUPS Calendar and Commodities Impact Dashboard demonstrates how Python can retrieve, normalize, display, and summarize corporate calendar and commodity market data from the Indonesia Stock Exchange API.
Using requests and pandas, the notebook retrieves two API responses, converts different data structures into consistent records, displays selected fields, classifies commodity impacts, identifies the largest price movement, and produces a concise market dashboard.
The result is a flexible Python workflow for monitoring upcoming RUPS events together with commodity conditions that may influence related Indonesian stocks.