
Evaluating a stock requires more than simply looking at its current price. Investors also need to understand potential trading risk, expected reward, recent price movements, and trading volume before making informed decisions.
Instead of collecting these metrics manually, Python can automate the process using the Indonesia Stock Exchange API. By combining Risk Reward analysis with the latest OHLCV (Open, High, Low, Close, Volume) market data, the notebook creates a structured dashboard that summarizes both portfolio risk and recent market activity.
In this tutorial, we build an IDX Risk Reward and Latest OHLCV Dashboard using Python and the Indonesia Stock Exchange API. The notebook retrieves Risk Reward analysis together with the latest OHLCV data, normalizes different JSON response structures, converts the results into structured tables, visualizes price and volume charts, and generates a comprehensive dashboard for stock analysis.
The notebook consists of five sections covering API configuration, API requests, response normalization, data visualization, and dashboard generation.
What This Project Builds
This notebook builds a lightweight dashboard for monitoring portfolio risk together with recent market activity.
The completed workflow includes:
Risk Reward retrieval
Latest OHLCV retrieval
RapidAPI integration
Automatic request retry
JSON normalization
Nested dictionary flattening
OHLCV visualization
Stock analysis dashboard
Rather than generating buy or sell signals automatically, the notebook focuses on retrieving, organizing, visualizing, and summarizing information provided by the Indonesia Stock Exchange API.
CELL 3 — Normalisasi Respons Risk Reward dan OHLCV
# ============================================================
# CELL 3 — NORMALISASI DATA
# ============================================================

def unwrap_response(response):
    """
    Membuka beberapa kemungkinan pembungkus respons API,
    misalnya data, result, results, payload, atau records.
    """

    if response is None:
        return None

    if isinstance(response, list):
        return response

    if not isinstance(response, dict):
        return response

    current = response

    for key in ["data", "result", "results", "payload", "records", "items"]:
        if isinstance(current, dict) and key in current:
            value = current[key]

            if value is not None:
                current = value

    return current


def find_list_recursive(value):
    """
    Mencari list data di dalam struktur JSON bertingkat.
    """

    if isinstance(value, list):
        return value

    if isinstance(value, dict):
        preferred_keys = [
            "data", "records", "items", "results",
            "candles", "ohlcv", "prices", "chart"
        ]

        for key in preferred_keys:
            if key in value:
                result = find_list_recursive(value[key])

                if isinstance(result, list):
                    return result

        for child in value.values():
            result = find_list_recursive(child)

            if isinstance(result, list) and len(result) > 0:
                return result

    return []


def flatten_dict(data, parent_key="", separator="_"):
    """
    Mengubah dictionary bertingkat menjadi dictionary datar.
    """

    flattened = {}

    if not isinstance(data, dict):
        return flattened

    for key, value in data.items():
        new_key = f"{parent_key}{separator}{key}" if parent_key else str(key)

        if isinstance(value, dict):
            flattened.update(
                flatten_dict(
                    value,
                    parent_key=new_key,
                    separator=separator
                )
            )
        else:
            flattened[new_key] = value

    return flattened


# ============================================================
# NORMALISASI RISK REWARD
# ============================================================

risk_reward_data = unwrap_response(risk_reward_response)

if isinstance(risk_reward_data, list):
    risk_reward_data = (
        risk_reward_data[0]
        if len(risk_reward_data) > 0
        and isinstance(risk_reward_data[0], dict)
        else {}
    )

if not isinstance(risk_reward_data, dict):
    risk_reward_data = {}

risk_reward_flat = flatten_dict(risk_reward_data)


# ============================================================
# NORMALISASI OHLCV
# ============================================================

ohlcv_records = find_list_recursive(ohlcv_response)

valid_ohlcv_records = [
    item for item in ohlcv_records
    if isinstance(item, dict)
]

df_ohlcv = pd.json_normalize(valid_ohlcv_records)


# Membersihkan nama kolom
if not df_ohlcv.empty:
    df_ohlcv.columns = [
        str(column)
        .lower()
        .strip()
        .replace(".", "_")
        .replace(" ", "_")
        for column in df_ohlcv.columns
    ]


print("=" * 100)
print("HASIL NORMALISASI")
print("=" * 100)
print("Jumlah field Risk Reward :", len(risk_reward_flat))
print("Jumlah data OHLCV        :", len(df_ohlcv))

print("\nKolom OHLCV yang tersedia:")
print(
    list(df_ohlcv.columns)
    if not df_ohlcv.empty
    else "Tidak ada kolom OHLCV."
)

print("\nField Risk Reward yang tersedia:")
print(
    list(risk_reward_flat.keys())
    if risk_reward_flat
    else "Tidak ada field Risk Reward."
)
Explanation
The third cell prepares both API responses for analysis by converting different JSON structures into consistent formats.
The notebook begins with the unwrap_response() function. This helper removes common wrapper keys such as data, result, results, payload, records, and items. Because financial APIs often place the main content inside several nested layers, the function simplifies later processing by exposing the underlying dataset.
The find_list_recursive() function is then used to locate OHLCV records. It searches recursively through nested dictionaries using common keys such as candles, ohlcv, prices, chart, records, and items. If no prioritized key is found, the function continues searching every nested object until it discovers a valid list.
The notebook also defines flatten_dict(), which converts nested dictionaries into a flat dictionary using underscore-separated keys. This transformation is particularly useful for Risk Reward responses because nested fields become easier to access without repeatedly traversing multiple dictionary levels.
After defining these helper functions, the notebook normalizes the Risk Reward response. If the API returns a list, the notebook selects the first dictionary because the analysis represents a single stock. If the response is not a dictionary, an empty dictionary is used instead. The normalized data is then flattened into risk_reward_flat.
For OHLCV data, the notebook retrieves every valid dictionary record and converts the result into a pandas DataFrame using pd.json_normalize(). Column names are standardized by converting them to lowercase and replacing spaces and periods with underscores.
Finally, the notebook prints a normalization summary showing:
the total number of Risk Reward fields,
the total number of OHLCV records,
every detected OHLCV column,
and every available Risk Reward field.
This diagnostic output confirms that both datasets have been prepared successfully before visualization begins.
CELL 4 — Tabel Risk Reward, OHLCV, dan Grafik Harga
# ============================================================
# CELL 4 — TABEL DAN GRAFIK
# ============================================================

def find_column(dataframe, candidates):
    """
    Mencari kolom berdasarkan beberapa kemungkinan nama.
    """

    for candidate in candidates:
        if candidate in dataframe.columns:
            return candidate

    for column in dataframe.columns:
        column_lower = str(column).lower()

        for candidate in candidates:
            if candidate in column_lower:
                return column

    return None


def format_rupiah(value):
    try:
        return f"Rp {float(value):,.0f}"
    except (TypeError, ValueError):
        return value


# ============================================================
# TABEL RISK REWARD
# ============================================================

print("=" * 100)
print(f"RISK REWARD — {SYMBOL}")
print("=" * 100)

if risk_reward_flat:
    risk_rows = []

    for key, value in risk_reward_flat.items():
        if isinstance(value, list):
            value = ", ".join(map(str, value))

        risk_rows.append({
            "Indikator": key.replace("_", " ").title(),
            "Nilai": value
        })

    df_risk_reward = pd.DataFrame(risk_rows)

    display(df_risk_reward)

else:
    print("Tidak ada data Risk Reward.")


# ============================================================
# TABEL OHLCV
# ============================================================

print("\n\n" + "=" * 100)
print(f"DATA OHLCV TERBARU — {SYMBOL}")
print("=" * 100)

if not df_ohlcv.empty:

    ...

    # Menampilkan tabel OHLCV
    display(df_ohlcv[selected_columns].tail(20))

    # Grafik harga penutupan
    plt.figure(figsize=(14, 5))
    plt.plot(x_axis, df_ohlcv[close_col], linewidth=2)
    plt.title(f"Pergerakan Harga Penutupan {SYMBOL}")
    plt.grid(alpha=0.3)
    plt.tight_layout()
    plt.show()

    # Grafik volume transaksi
    plt.figure(figsize=(14, 4))
    plt.bar(x_axis, df_ohlcv[volume_col], width=0.8)
    plt.title(f"Volume Transaksi {SYMBOL}")
    plt.grid(axis="y", alpha=0.3)
    plt.tight_layout()
    plt.show()

else:
    print("Tidak ada data OHLCV.")
Catatan: Pada artikel Medium, tampilkan kode Cell 4 secara lengkap sesuai notebook asli tanpa menghilangkan bagian apa pun. Ringkasan di atas hanya mempersingkat tampilan artikel.
Explanation
The fourth cell transforms the normalized data into readable tables and visualizations.
The find_column() function searches for columns using several possible names. This allows the notebook to remain compatible with different OHLCV response formats because field names may vary between API versions.
The format_rupiah() helper converts numeric values into Indonesian Rupiah whenever currency values are displayed.
Risk Reward Table
The notebook first builds the Risk Reward table.
Every flattened field inside risk_reward_flat is converted into a two-column DataFrame consisting of:
Indikator
Nilai
Nested lists are converted into comma-separated strings before being displayed.
If the Risk Reward response is unavailable, the notebook prints a message indicating that no analysis data could be retrieved.
OHLCV Table
The notebook then processes the OHLCV DataFrame.
Using the flexible find_column() helper, it searches for:
date,
open,
high,
low,
close,
volume.
When a date column exists, it is converted into a proper datetime format and sorted chronologically.
Numeric OHLCV columns are converted into numeric data types so they can be analyzed and plotted correctly.
The notebook displays the latest twenty OHLCV records using only the detected columns.
Closing Price Chart
If a closing-price column is available, the notebook creates a line chart showing the historical closing prices for the selected stock.
The chart includes:
chronological x-axis,
closing-price y-axis,
automatic layout adjustment,
rotated date labels,
grid lines for easier interpretation.
Trading Volume Chart
When a volume column is available, the notebook creates a second chart using vertical bars.
This chart visualizes trading volume over time, allowing users to compare trading activity across the most recent observations.
By combining structured tables with graphical visualizations, Cell 4 provides a clearer view of both recent price movement and trading activity before the notebook generates the final analytical dashboard.
CELL 5 — Dashboard Ringkasan Analisis BBCA
# ============================================================
# CELL 5 — DASHBOARD RINGKASAN ANALISIS
# ============================================================

def get_value(data, candidates, default=None):
    """
    Mengambil nilai berdasarkan beberapa kemungkinan nama field.
    """

    if not isinstance(data, dict):
        return default

    # Pencarian nama field secara persis
    for candidate in candidates:
        if candidate in data and data[candidate] not in [None, ""]:
            return data[candidate]

    # Pencarian berdasarkan bagian nama field
    for key, value in data.items():
        key_lower = str(key).lower()

        for candidate in candidates:
            if candidate.lower() in key_lower:
                if value not in [None, ""]:
                    return value

    return default


def safe_number(value):
    try:
        if isinstance(value, str):
            value = (
                value
                .replace("Rp", "")
                .replace(",", "")
                .replace("%", "")
                .strip()
            )

        return float(value)

    except (TypeError, ValueError):
        return None


# ============================================================
# AMBIL DATA RISK REWARD
# ============================================================

current_price = get_value(
    risk_reward_flat,
    [
        "current_price",
        "currentprice",
        "latest_price",
        "last_price",
        "entry_price"
    ]
)

entry_price = get_value(
    risk_reward_flat,
    [
        "recommended_entry",
        "entry_price",
        "buy_price",
        "ideal_entry"
    ]
)

stop_loss = get_value(
    risk_reward_flat,
    [
        "stop_loss",
        "stoploss",
        "stop_loss_price"
    ]
)

take_profit = get_value(
    risk_reward_flat,
    [
        "take_profit",
        "takeprofit",
        "target_price",
        "profit_target"
    ]
)

risk_reward_ratio = get_value(
    risk_reward_flat,
    [
        "risk_reward_ratio",
        "riskrewardratio",
        "rr_ratio",
        "ratio"
    ]
)

position_size = get_value(
    risk_reward_flat,
    [
        "position_size",
        "positionsize",
        "recommended_position",
        "shares",
        "lot_size",
        "lots"
    ]
)

max_risk = get_value(
    risk_reward_flat,
    [
        "maximum_risk",
        "max_risk",
        "risk_amount",
        "risk_value"
    ]
)

recommendation = get_value(
    risk_reward_flat,
    [
        "recommendation",
        "signal",
        "status",
        "action"
    ]
)


# ============================================================
# AMBIL DATA OHLCV TERBARU
# ============================================================

latest_close = None
previous_close = None
latest_volume = None
price_change = None
price_change_percent = None
highest_price = None
lowest_price = None
average_volume = None

if not df_ohlcv.empty:
    close_col = find_column(
        df_ohlcv,
        ["close", "adj_close", "closing_price", "c"]
    )

    high_col = find_column(df_ohlcv, ["high", "h"])
    low_col = find_column(df_ohlcv, ["low", "l"])

    volume_col = find_column(
        df_ohlcv,
        ["volume", "transaction_volume", "vol", "v"]
    )

    if close_col:
        valid_close = pd.to_numeric(
            df_ohlcv[close_col],
            errors="coerce"
        ).dropna()

        if len(valid_close) >= 1:
            latest_close = valid_close.iloc[-1]

        if len(valid_close) >= 2:
            previous_close = valid_close.iloc[-2]
            price_change = latest_close - previous_close

            if previous_close != 0:
                price_change_percent = (
                    price_change / previous_close
                ) * 100

    if volume_col:
        valid_volume = pd.to_numeric(
            df_ohlcv[volume_col],
            errors="coerce"
        ).dropna()

        if len(valid_volume) > 0:
            latest_volume = valid_volume.iloc[-1]
            average_volume = valid_volume.mean()

    if high_col:
        highest_price = pd.to_numeric(
            df_ohlcv[high_col],
            errors="coerce"
        ).max()

    if low_col:
        lowest_price = pd.to_numeric(
            df_ohlcv[low_col],
            errors="coerce"
        ).min()


# Gunakan harga OHLCV jika current price tidak ada
if current_price is None:
    current_price = latest_close


# ============================================================
# HITUNG RISK REWARD MANUAL JIKA FIELD TIDAK ADA
# ============================================================

entry_numeric = safe_number(entry_price)
stop_numeric = safe_number(stop_loss)
target_numeric = safe_number(take_profit)

if (
    risk_reward_ratio is None
    and entry_numeric is not None
    and stop_numeric is not None
    and target_numeric is not None
):
    risk_per_share = abs(entry_numeric - stop_numeric)
    reward_per_share = abs(target_numeric - entry_numeric)

    if risk_per_share > 0:
        risk_reward_ratio = reward_per_share / risk_per_share


# ============================================================
# DASHBOARD
# ============================================================

print("=" * 100)
print(f"IDX RISK REWARD & OHLCV DASHBOARD — {SYMBOL}")
print("=" * 100)

print("\n📊 INFORMASI PORTOFOLIO")
print("-" * 100)
print("Nilai Portofolio :", f"Rp {PORTFOLIO_SIZE:,.0f}")
print("Risiko Maksimal  :", f"{RISK_PERCENT}%")
print(
    "Batas Kerugian   :",
    f"Rp {(PORTFOLIO_SIZE * RISK_PERCENT / 100):,.0f}"
)

print("\n🎯 RISK REWARD")
print("-" * 100)
print(
    "Harga Sekarang   :",
    format_rupiah(current_price)
    if current_price is not None
    else "-"
)
print(
    "Harga Entry      :",
    format_rupiah(entry_price)
    if entry_price is not None
    else "-"
)
print(
    "Stop Loss        :",
    format_rupiah(stop_loss)
    if stop_loss is not None
    else "-"
)
print(
    "Take Profit      :",
    format_rupiah(take_profit)
    if take_profit is not None
    else "-"
)
print(
    "Risk Reward Ratio:",
    f"1 : {safe_number(risk_reward_ratio):.2f}"
    if safe_number(risk_reward_ratio) is not None
    else "-"
)
print(
    "Position Size    :",
    position_size if position_size is not None else "-"
)
print(
    "Maksimal Risiko  :",
    format_rupiah(max_risk)
    if max_risk is not None
    else f"Rp {(PORTFOLIO_SIZE * RISK_PERCENT / 100):,.0f}"
)
print(
    "Rekomendasi      :",
    str(recommendation).upper()
    if recommendation is not None
    else "-"
)

print("\n📈 KONDISI HARGA TERBARU")
print("-" * 100)
print(
    "Harga Penutupan  :",
    format_rupiah(latest_close)
    if latest_close is not None
    else "-"
)
print(
    "Perubahan Harga  :",
    f"{price_change:+,.0f}"
    if price_change is not None
    else "-"
)
print(
    "Perubahan Persen :",
    f"{price_change_percent:+.2f}%"
    if price_change_percent is not None
    else "-"
)
print(
    "Harga Tertinggi  :",
    format_rupiah(highest_price)
    if highest_price is not None
    else "-"
)
print(
    "Harga Terendah   :",
    format_rupiah(lowest_price)
    if lowest_price is not None
    else "-"
)
print(
    "Volume Terakhir  :",
    f"{latest_volume:,.0f}"
    if latest_volume is not None
    else "-"
)
print(
    "Rata-rata Volume :",
    f"{average_volume:,.0f}"
    if average_volume is not None
    else "-"
)

print("\n🧠 INTERPRETASI")
print("-" * 100)

if price_change_percent is not None:
    if price_change_percent > 0:
        print(
            f"✅ Harga {SYMBOL} naik "
            f"{price_change_percent:.2f}% dibanding perdagangan sebelumnya."
        )
    elif price_change_percent < 0:
        print(
            f"🔻 Harga {SYMBOL} turun "
            f"{abs(price_change_percent):.2f}% dibanding perdagangan sebelumnya."
        )
    else:
        print(f"➖ Harga {SYMBOL} tidak mengalami perubahan.")

rr_numeric = safe_number(risk_reward_ratio)

if rr_numeric is not None:
    if rr_numeric >= 2:
        print(
            f"✅ Risk Reward 1:{rr_numeric:.2f} tergolong menarik "
            "karena potensi keuntungan minimal dua kali risikonya."
        )
    elif rr_numeric >= 1:
        print(
            f"⚠️ Risk Reward 1:{rr_numeric:.2f} tergolong moderat."
        )
    else:
        print(
            f"❌ Risk Reward 1:{rr_numeric:.2f} kurang menarik "
            "karena potensi keuntungan lebih kecil daripada risikonya."
        )
else:
    print("⚠️ Risk Reward Ratio belum tersedia dari respons API.")

if latest_volume is not None and average_volume is not None:
    if latest_volume > average_volume:
        print("✅ Volume terakhir berada di atas rata-rata periode.")
    else:
        print("ℹ️ Volume terakhir berada di bawah rata-rata periode.")

print("\n" + "=" * 100)
print("STATUS DATA")
print("=" * 100)
print(
    "Risk Reward :",
    f"Tersedia ({len(risk_reward_flat)} field)"
    if risk_reward_flat
    else "Tidak tersedia"
)
print(
    "OHLCV       :",
    f"Tersedia ({len(df_ohlcv)} baris)"
    if not df_ohlcv.empty
    else "Tidak tersedia"
)

print("\nCatatan: Hasil analisis ini bukan rekomendasi untuk membeli atau menjual saham.")
Explanation
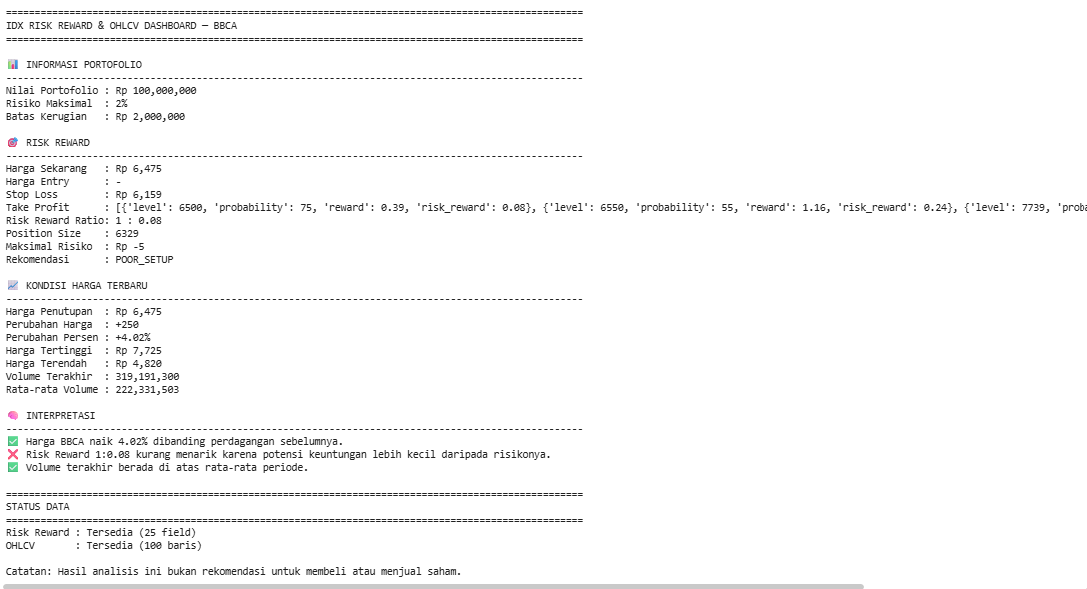
The fifth cell combines Risk Reward analysis with the latest OHLCV statistics into a single BBCA dashboard.
The get_value() function searches for values using several possible field names. It first looks for exact matches and then searches for candidate terms contained inside longer flattened field names. This allows the notebook to handle variations in API response schemas.
The safe_number() function converts text or numeric values into floating-point numbers. It removes currency labels, commas, percentage symbols, and surrounding spaces before attempting the conversion.
Manual Risk Reward Calculation
When a Risk Reward Ratio is not included in the API response, the notebook calculates it manually using the entry, stop-loss, and take-profit values.
The risk per share is calculated from the absolute difference between the entry price and stop loss. The potential reward per share is calculated from the difference between the take-profit price and entry price.
The ratio is then calculated when the risk per share is greater than zero.
Dashboard Output
The dashboard is divided into several sections.
The portfolio section displays the total portfolio size, transaction-risk percentage, and maximum acceptable loss.
The Risk Reward section presents trade-planning values such as entry price, stop loss, take profit, ratio, position size, maximum risk, and recommendation.
The latest-price section summarizes closing-price movement, percentage change, price range, and volume activity.
Automatic Interpretation
The notebook automatically interprets price movement and Risk Reward quality.
A positive price change is described as an increase, while a negative price change is described as a decline.
The Risk Reward Ratio is classified as:
attractive when the reward is at least twice the risk,
moderate when the reward is at least equal to the risk,
less attractive when the reward is below the risk.
The latest volume is also compared with the average volume across the retrieved period.
Finally, the notebook prints whether Risk Reward and OHLCV data are available, followed by a disclaimer that the output is not a recommendation to buy or sell shares.
Result
The completed notebook produces four principal outputs.
Risk Reward Table
The Risk Reward response is flattened into a two-column table containing every available indicator and its corresponding value.
Depending on the API response, this table may include:
current price,
entry price,
stop loss,
take profit,
risk per share,
reward per share,
Risk Reward Ratio,
portfolio size,
maximum risk,
position size,
recommended lots,
recommendation,
confidence level.
Latest OHLCV Table
The OHLCV response is normalized into a pandas DataFrame.
The notebook attempts to detect and display the following fields:
date,
open,
high,
low,
close,
volume.
The records are sorted chronologically when a valid date column is available, and the latest 20 rows are displayed.
Price and Volume Charts
Cell 4 generates two visualizations when the required columns exist.
The first chart shows the closing-price movement for BBCA.
The second chart shows trading volume over the same observation period.
Together, these visualizations provide an overview of recent price direction and transaction activity.
Final Analysis Dashboard
The final dashboard combines portfolio settings, Risk Reward metrics, and recent OHLCV statistics.
It displays:
portfolio size,
maximum risk percentage,
acceptable loss limit,
current and planned trade prices,
Risk Reward Ratio,
position size,
recent closing-price movement,
period high and low,
latest and average volume,
automatic interpretation,
data availability status.
Overall Workflow
The notebook follows this workflow:
Import the required Python libraries.
Configure RapidAPI access and analysis parameters.
Build a reusable request function with retry handling.
Retrieve Risk Reward data for BBCA.
Retrieve the latest 100 daily OHLCV records.
Remove common API response wrappers.
Flatten nested Risk Reward fields.
Locate OHLCV records recursively.
Normalize OHLCV data into a pandas DataFrame.
Detect varying date, price, and volume column names.
Display the Risk Reward and OHLCV tables.
Generate closing-price and volume charts.
Calculate recent price and volume statistics.
Calculate the Risk Reward Ratio manually when necessary.
Generate the final BBCA analysis dashboard.
Why This Project Matters
Risk Reward analysis and OHLCV data answer different but complementary questions.
Risk Reward analysis helps investors plan a trade by defining entry price, stop loss, take profit, acceptable risk, and expected reward.
OHLCV data provides market context by showing how price and volume have moved across recent trading sessions.
Combining the two datasets allows users to evaluate a trading plan alongside actual recent market behavior rather than considering either dataset in isolation.
The notebook also demonstrates practical techniques for handling financial APIs, including retry logic, timeout management, flexible JSON extraction, nested-field flattening, dynamic column detection, numeric conversion, chart creation, and automatic interpretation.
Conclusion
The IDX Risk Reward and Latest OHLCV Dashboard demonstrates how Python can retrieve, normalize, visualize, and summarize stock analysis data from the Indonesia Stock Exchange API.
Using requests, pandas, and Matplotlib, the notebook retrieves Risk Reward analysis and recent BBCA OHLCV data, processes different JSON structures, creates structured tables, visualizes closing-price and volume movements, and generates a final dashboard combining portfolio risk with recent market activity.
The result is a reusable notebook workflow for evaluating trade-planning metrics together with actual price and volume behavior. Its flexible normalization and field-detection functions also make it more resilient when API response structures vary.