
Dividend schedules and economic events are two important sources of information for investors monitoring the Indonesian capital market. Dividend announcements help investors identify upcoming corporate distributions, while economic calendar events provide additional context that may influence overall market conditions.
Rather than checking these updates manually from multiple sources, Python can automate the retrieval process through the Indonesia Stock Exchange API. Once the responses are received, they can be normalized into a consistent structure, processed into event records, and summarized in a simple market dashboard.
In this tutorial, we build an IDX Dividend Calendar and Economic Calendar Dashboard using Python and the Indonesia Stock Exchange API. The notebook retrieves Dividend Calendar and Economic Calendar data, handles API requests with retry logic, normalizes different JSON response structures, extracts event records, and generates a dashboard summarizing available market events.
The notebook consists of five sequential sections covering API configuration, API requests, JSON normalization, event processing, and dashboard generation.
What This Project Builds
This notebook builds a lightweight dashboard for monitoring Dividend Calendar and Economic Calendar events published by the Indonesia Stock Exchange.
The completed workflow includes:
Dividend Calendar retrieval
Economic Calendar retrieval
RapidAPI integration
Retry mechanism
JSON normalization
Recursive record extraction
Event processing
Market dashboard summary
Rather than forecasting market movements, the notebook focuses on retrieving, organizing, and summarizing market calendar events obtained directly from the Indonesia Stock Exchange API.
CELL 1 — Import & Configuration
import requests
import pandas as pd
from datetime import datetime
from IPython.display import display

API_KEY = "YOUR_API_KEY"

BASE_URL = "https://indonesia-stock-exchange-idx.p.rapidapi.com"

headers = {
    "x-rapidapi-key": API_KEY,
    "x-rapidapi-host": "indonesia-stock-exchange-idx.p.rapidapi.com",
    "Content-Type": "application/json"
}
Note: Replace the original API key with
YOUR_API_KEYbefore publishing or sharing the notebook publicly.
Explanation
The notebook begins by importing the Python libraries required throughout the project.
The requests library is responsible for communicating with the Indonesia Stock Exchange API through RapidAPI. Every API request performed later in the notebook uses this library to retrieve Dividend Calendar and Economic Calendar information.
The notebook imports pandas to transform the returned JSON responses into structured data structures that can be processed more efficiently. The datetime module is imported for generating timestamps in the final dashboard, while display from IPython.display is available for presenting DataFrames clearly inside the notebook environment.
The second part of the cell prepares the API configuration. The authentication key is stored inside the API_KEY variable, followed by the API base URL and the HTTP request headers required for every API request.
Keeping these configuration variables together makes the notebook easier to maintain because all subsequent API requests reuse the same authentication settings.
CELL 2 — Request Dividend and Economic Calendar
import time

def request_api(endpoint, nama_api, timeout=45, max_retry=2):
    url = BASE_URL + endpoint

    for percobaan in range(1, max_retry + 1):
        try:
            response = requests.get(
                url,
                headers=headers,
                timeout=timeout
            )

            print("=" * 75)
            print(nama_api.upper())
            print("=" * 75)
            print("Endpoint  :", endpoint)
            print("Percobaan :", percobaan)
            print("Status    :", response.status_code)

            if response.status_code == 200:
                try:
                    data = response.json()
                    print("✅ Data berhasil diambil.\n")
                    return data

                except ValueError:
                    print("❌ Respons bukan JSON.")
                    print("Response:", response.text[:500], "\n")
                    return None

            elif response.status_code == 401:
                print("❌ API Key tidak valid atau belum dimasukkan.")
                print("Response:", response.text[:500], "\n")
                return None

            elif response.status_code == 403:
                print("❌ Akses endpoint ditolak.")
                print("Kemungkinan akun RapidAPI belum subscribe ke endpoint ini.")
                print("Response:", response.text[:500], "\n")
                return None

            elif response.status_code == 429:
                print("⚠️ Rate limit tercapai.")

                if percobaan < max_retry:
                    print("Mencoba kembali setelah 5 detik...\n")
                    time.sleep(5)
                    continue

                print("❌ Request tetap gagal karena rate limit.\n")
                return None

            else:
                print("❌ Request gagal.")
                print("Response:", response.text[:500], "\n")
                return None

        except requests.exceptions.Timeout:
            print(f"⚠️ Request timeout pada percobaan {percobaan}.")

            if percobaan < max_retry:
                print("Mencoba kembali...\n")
                time.sleep(3)
                continue

            print("❌ Server terlalu lama memberikan respons.\n")
            return None

        except requests.exceptions.ConnectionError as error:
            print("❌ Tidak dapat terhubung ke server.")
            print("Detail:", error, "\n")
            return None

        except requests.exceptions.RequestException as error:
            print("❌ Request Error:", error, "\n")
            return None

    return None


dividend_json = request_api(
    "/api/calendar/dividend",
    "Dividend Calendar"
)

time.sleep(2)

economic_json = request_api(
    "/api/calendar/economic",
    "Economic Calendar"
)
Explanation
The second section retrieves data from the Dividend Calendar and Economic Calendar endpoints.
The notebook defines a reusable helper function named request_api() that manages communication with the Indonesia Stock Exchange API. Instead of repeating the same request logic for each endpoint, the function centralizes API communication while adding retry handling and detailed status reporting.
Each request begins by combining the predefined BASE_URL with the selected endpoint before sending an authenticated HTTP GET request.
During execution, the notebook prints the endpoint, retry attempt, and HTTP status code. These messages make it easier to monitor request progress and diagnose API-related issues.
The helper function also handles several common API responses. Successful requests return parsed JSON data, while invalid API keys (401), unavailable endpoints (403), request limits (429), timeout errors, connection failures, and other request exceptions are handled gracefully without interrupting the notebook.
After defining the helper function, the notebook retrieves Dividend Calendar data. A short two-second delay is then introduced before requesting the Economic Calendar endpoint, reducing the likelihood of triggering RapidAPI rate limits.
By the end of this cell, both API responses are available for normalization and further processing in the following sections.
CELL 3 — Normalize API Response Structure
def extract_records(data):
    """
    Mencari list data di berbagai struktur respons JSON.
    Tidak menganggap dictionary utama sebagai event.
    """

    if data is None:
        return []

    if isinstance(data, list):
        return [item for item in data if isinstance(item, dict)]

    if not isinstance(data, dict):
        return []

    possible_keys = [
        "data",
        "result",
        "results",
        "items",
        "events",
        "calendar",
        "dividend",
        "dividends",
        "economic",
        "economics",
        "economicCalendar",
        "economic_calendar"
    ]

    # Pencarian level pertama
    for key in possible_keys:
        value = data.get(key)

        if isinstance(value, list):
            return [item for item in value if isinstance(item, dict)]

    # Pencarian rekursif ke dictionary di dalam respons
    for value in data.values():
        if isinstance(value, dict):
            records = extract_records(value)

            if records:
                return records

        elif isinstance(value, list):
            valid_records = [
                item for item in value
                if isinstance(item, dict)
            ]

            if valid_records:
                return valid_records

    return []


dividend_records = extract_records(dividend_json)
economic_records = extract_records(economic_json)

print("=" * 70)
print("HASIL NORMALISASI")
print("=" * 70)
print("Dividend Records :", len(dividend_records))
print("Economic Records :", len(economic_records))

print("\nDEBUG STRUKTUR RESPONS")

if isinstance(dividend_json, dict):
    print("Dividend Keys :", list(dividend_json.keys()))
else:
    print("Dividend Type :", type(dividend_json).__name__)

if isinstance(economic_json, dict):
    print("Economic Keys :", list(economic_json.keys()))
else:
    print("Economic Type :", type(economic_json).__name__)
Explanation
After retrieving both API responses, the notebook normalizes the returned JSON structures before performing further analysis.
The notebook defines a helper function named extract_records(), which is responsible for locating the actual event records regardless of how the API organizes its JSON response.
The function first checks whether the response is empty. If the response is None, it immediately returns an empty list so that the remaining notebook can continue without generating errors.
If the response is already a list, only dictionary objects are kept because each dictionary represents an individual event.
When the response is a dictionary, the function searches several commonly used keys such as data, result, results, items, events, calendar, dividend, economic, and other possible variations. If one of these keys contains a list of dictionaries, that list is returned as the final dataset.
If no matching key is found, the function performs a recursive search through every nested dictionary and list contained inside the JSON response. This recursive approach allows the notebook to support multiple response formats without requiring manual changes whenever the API structure varies.
After the normalization process, the notebook stores the extracted Dividend Calendar records inside dividend_records and the Economic Calendar records inside economic_records.
The notebook then prints the total number of records extracted from each dataset before displaying a small debugging summary. If the original response is a dictionary, the available top-level JSON keys are displayed. Otherwise, the notebook prints the response type.
This debugging information helps users understand the structure returned by each endpoint and confirms whether the normalization process successfully located the expected event records.
CELL 4 — Create Dividend and Economic Calendar Tables
def extract_records(data):
    """
    Mencari list data di berbagai struktur respons JSON.
    Tidak menganggap dictionary utama sebagai event.
    """

    if data is None:
        return []

    if isinstance(data, list):
        return [item for item in data if isinstance(item, dict)]

    if not isinstance(data, dict):
        return []

    possible_keys = [
        "data",
        "result",
        "results",
        "items",
        "events",
        "calendar",
        "dividend",
        "dividends",
        "economic",
        "economics",
        "economicCalendar",
        "economic_calendar"
    ]

    # Pencarian level pertama
    for key in possible_keys:
        value = data.get(key)

        if isinstance(value, list):
            return [item for item in value if isinstance(item, dict)]

    # Pencarian rekursif ke dictionary di dalam respons
    for value in data.values():
        if isinstance(value, dict):
            records = extract_records(value)

            if records:
                return records

        elif isinstance(value, list):
            valid_records = [
                item for item in value
                if isinstance(item, dict)
            ]

            if valid_records:
                return valid_records

    return []


dividend_records = extract_records(dividend_json)
economic_records = extract_records(economic_json)

print("=" * 70)
print("HASIL NORMALISASI")
print("=" * 70)
print("Dividend Records :", len(dividend_records))
print("Economic Records :", len(economic_records))

print("\nDEBUG STRUKTUR RESPONS")

if isinstance(dividend_json, dict):
    print("Dividend Keys :", list(dividend_json.keys()))
else:
    print("Dividend Type :", type(dividend_json).__name__)

if isinstance(economic_json, dict):
    print("Economic Keys :", list(economic_json.keys()))
else:
    print("Economic Type :", type(economic_json).__name__)
Explanation
The fourth section repeats the normalization workflow to ensure that both Dividend Calendar and Economic Calendar datasets are available in a consistent format before they are used by the dashboard.
The notebook defines the same extract_records() function, allowing the extraction process to remain independent of the original JSON structure returned by the API.
Once the records have been extracted, the notebook recreates both normalized datasets by assigning the results to dividend_records and economic_records.
The notebook then prints a normalization summary showing the total number of Dividend Calendar records and Economic Calendar records detected after processing.
Finally, the notebook displays debugging information by printing the top-level JSON keys for each API response whenever the response is a dictionary. If the response is not a dictionary, the notebook prints its data type instead.
This repeated validation step allows users to verify that both API responses have been processed successfully before the notebook continues to generate the final dashboard. It also helps identify situations where an endpoint returns an unexpected response structure or no event records at all.
CELL 5 — Summary Dashboard
jumlah_dividend = len(df_dividend)
jumlah_economic = len(df_economic)
total_event = jumlah_dividend + jumlah_economic

print("=" * 75)
print("IDX DIVIDEND & ECONOMIC CALENDAR DASHBOARD")
print("=" * 75)

print("Waktu Pembaruan :", datetime.now().strftime("%d-%m-%Y %H:%M:%S"))
print()
print(f"💰 Dividend Calendar : {jumlah_dividend} event")
print(f"📊 Economic Calendar : {jumlah_economic} event")
print(f"📌 Total Event        : {total_event}")

print("\nSTATUS DATA")
print(
    "Dividend Calendar :",
    "✅ Tersedia" if jumlah_dividend > 0 else "⚠️ Tidak tersedia"
)
print(
    "Economic Calendar :",
    "✅ Tersedia" if jumlah_economic > 0 else "⚠️ Tidak tersedia"
)

if total_event > 0:
    print("\n✅ Dashboard berhasil dibuat.")
else:
    print("\n⚠️ Belum ada data yang dapat ditampilkan.")
    print("Periksa API Key, subscription, dan rate limit RapidAPI.")
Explanation
The final cell creates a concise dashboard summarizing the number of Dividend Calendar and Economic Calendar events.
The notebook begins by calculating the number of records stored inside df_dividend and df_economic. These values are saved as jumlah_dividend and jumlah_economic, while total_event combines both counts into a single total.
The dashboard then prints a formatted title together with the current update time. The timestamp is generated using datetime.now().strftime(), allowing users to see exactly when the dashboard was executed.
Three summary values are displayed:
the number of Dividend Calendar events,
the number of Economic Calendar events,
and the combined number of events.
The notebook also provides a simple availability status for both datasets. When a dataset contains at least one record, it is marked as available. When the record count is zero, the dashboard reports that the data is unavailable.
Finally, the notebook checks the combined event count. If at least one event exists, it confirms that the dashboard was created successfully. If both datasets are empty, it recommends checking the API key, RapidAPI subscription, and request limits.
Important implementation note: In the uploaded file,
df_dividendanddf_economicare referenced in Cell 5, but they are not created in the preceding cells. Cell 4 repeats the normalization code from Cell 3 instead of convertingdividend_recordsandeconomic_recordsinto DataFrames. Therefore, the notebook as uploaded may raise aNameErrorwhen Cell 5 is executed. This observation follows the file exactly; I have not changed the code.
Result
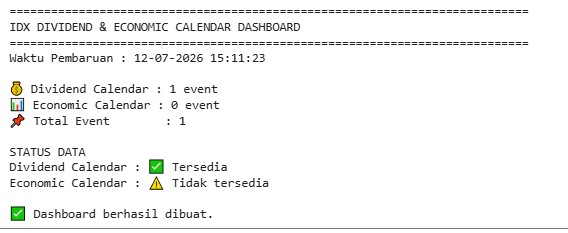
The notebook is designed to produce three main outputs: normalization results, response-structure debugging information, and a final calendar dashboard.
Dividend Calendar Result
The Dividend Calendar response is retrieved from:
/api/calendar/dividendThe notebook passes the returned JSON object into extract_records(). This function searches common keys and nested structures until it finds a list of dictionary records.
After normalization, the notebook prints the number of Dividend Calendar records found.
Example output structure:
Dividend Records : 463The exact count depends on the response returned by the API at execution time.
Economic Calendar Result
The Economic Calendar response is retrieved from:
/api/calendar/economicThe same recursive normalization function is used to search for Economic Calendar records.
If the endpoint is unavailable, denied, rate-limited, or returns no recognized list structure, the resulting record count may be zero.
Example:
Economic Records : 0The notebook also prints the response type or top-level keys to help users understand why no event list was found.
Response Structure Debugging
The notebook prints debugging information for both API responses.
When a response is a dictionary, it displays the available keys:
Dividend Keys : ['success', 'data']When the response is None, it displays:
Economic Type : NoneTypeThis output helps users determine whether the endpoint returned valid JSON, an unexpected schema, or no response at all.
Final Dashboard Result
The intended final dashboard displays:
update time,
total Dividend Calendar events,
total Economic Calendar events,
total combined events,
and the availability status of both datasets.
However, as written in the uploaded file, the dashboard depends on df_dividend and df_economic, which are not defined in the earlier cells. The source file would need those DataFrames to be created before Cell 5 can run successfully.
Overall Workflow
The notebook follows this five-cell workflow:
Import the required Python libraries and configure RapidAPI access.
Request Dividend Calendar data.
Pause briefly before requesting Economic Calendar data.
Handle authentication errors, access restrictions, rate limits, timeouts, and connection failures.
Normalize the JSON responses using recursive record extraction.
Count the Dividend Calendar and Economic Calendar records.
Print debugging information about the response structures.
Repeat the normalization process in Cell 4.
Attempt to generate a final dashboard using
df_dividendanddf_economic.
Why This Project Matters
Dividend schedules and economic events provide different but complementary perspectives on market activity.
Dividend Calendar data helps investors identify companies with upcoming dividend-related events. Economic Calendar data provides broader information about scheduled economic developments that may affect market conditions.
The notebook also demonstrates an important practical challenge when working with APIs: response structures are not always consistent. The recursive extract_records() function is designed to search multiple common keys and nested dictionaries rather than depending on a single fixed JSON structure.
Its request function also handles several common failure scenarios, including invalid API keys, subscription restrictions, rate limits, request timeouts, and connection errors.
These features make the project useful as a foundation for a more complete market-calendar dashboard.
Conclusion
The IDX Dividend Calendar and Economic Calendar Dashboard demonstrates how Python can retrieve and normalize market calendar data from the Indonesia Stock Exchange API.
Using requests, the notebook calls the Dividend Calendar and Economic Calendar endpoints. Its reusable request function handles common API errors and retries rate-limited or timed-out requests. The recursive normalization function then searches the returned JSON objects for usable event records.
The project concludes with a dashboard intended to summarize the number and availability of Dividend Calendar and Economic Calendar events.
One limitation remains in the uploaded source: Cell 5 refers to df_dividend and df_economic, while the earlier cells only create dividend_records and economic_records. As a result, the code is not fully executable in its current form without defining those two DataFrames first. The article above preserves the cell code exactly as provided.