
Monitoring daily market activity is an important part of financial analysis. Besides observing stock prices, investors often pay attention to corporate actions announced by listed companies and the impact of foreign exchange movements on the Indonesian market.
Corporate actions such as dividend distributions, annual shareholder meetings, and cum dates provide important information that may influence investment decisions. At the same time, fluctuations in the USD/IDR exchange rate can affect companies differently depending on whether they rely on imports or exports.
Instead of manually checking multiple websites every day, Python makes it possible to automate this process by retrieving market information directly from an API. Using a few widely adopted libraries, financial data can be collected, organized into structured tables, summarized, and visualized in only a few steps.
In this project, we build a Today Corporate Actions and Forex IDR Impact Dashboard using Python and the Indonesia Stock Exchange API. The notebook retrieves two different datasets through RapidAPI, prepares fallback sample data whenever the API is unavailable, converts the responses into pandas DataFrames, and visualizes the USD/IDR percentage change using Matplotlib.
The notebook is organized into five sequential sections that begin with library imports and API configuration before ending with dashboard visualization.
What This Project Builds
This notebook builds a simple financial dashboard that combines two datasets from the Indonesia Stock Exchange API:
Today Corporate Actions
Forex IDR Impact
API request handling
Fallback sample data
pandas DataFrame transformation
Forex impact visualization using Matplotlib
Rather than creating a complex analytical platform, the notebook focuses on retrieving live information, displaying it in a structured format, and presenting a simple visualization that can be used as the foundation for more advanced market monitoring applications.
CELL 1 — Install & Import
import requests
import pandas as pd
import matplotlib.pyplot as plt
from datetime import datetime
Explanation
The notebook begins by importing the libraries required throughout the project. These libraries provide the essential functionality needed to retrieve financial market data, process the API responses, and visualize the results.
The requests library is responsible for sending HTTP requests to the Indonesia Stock Exchange API through RapidAPI. Every dataset retrieved later in the notebook depends on this library to communicate with the remote endpoints.
After the API returns its response, pandas converts the JSON data into structured DataFrames. Organizing the information into tabular form makes it significantly easier to inspect, summarize, and display the retrieved market data.
The notebook also imports matplotlib.pyplot, which is used later to visualize the percentage change of the USD/IDR exchange rate. Although the visualization is intentionally simple, it provides a quick graphical representation of the forex movement instead of relying solely on numerical values.
Finally, the datetime module is imported to generate the current date. This date is used when creating fallback sample data for Today Corporate Actions, ensuring that the sample records always reflect the current execution date instead of using fixed historical values.
CELL 2 — API Configuration
RAPIDAPI_KEY = "YOUR_API_KEY"

BASE_URL = "https://indonesia-stock-exchange-idx.p.rapidapi.com"

HEADERS = {
    "Content-Type": "application/json",
    "x-rapidapi-host": "indonesia-stock-exchange-idx.p.rapidapi.com",
    "x-rapidapi-key": RAPIDAPI_KEY
}

endpoints = {
    "Today Corporate Actions": "/api/calendar/today",
    "Forex IDR Impact": "/api/main/forex-idr-impact"
}
Note: In the published article, replace the actual API key with
YOUR_API_KEYto avoid exposing private credentials.
Explanation
The second section prepares the configuration required for communicating with the Indonesia Stock Exchange API through RapidAPI.
The notebook begins by storing the RapidAPI authentication key inside the RAPIDAPI_KEY variable. Every request sent to the API later in the notebook uses this credential for authentication. For security reasons, the API key should never be published in public repositories or technical articles. When sharing the notebook, replacing the original value with YOUR_API_KEY is the recommended approach.
Next, the notebook defines the base URL for the Indonesia Stock Exchange API. Keeping the base address inside a dedicated variable simplifies future maintenance because endpoint URLs can be constructed dynamically instead of repeating the same address multiple times throughout the notebook.
The HEADERS dictionary contains all HTTP headers required by RapidAPI. In addition to specifying the content type, it includes both the RapidAPI host and the authentication key, ensuring that every API request follows the expected format.
Finally, the notebook creates a small dictionary named endpoints. Rather than hardcoding endpoint paths inside every request, the notebook stores the available API routes in one place. In this project, two endpoints are configured: Today Corporate Actions, which provides daily corporate action information, and Forex IDR Impact, which returns information related to the impact of USD/IDR exchange rate movements.
This configuration step completes the initial setup, allowing the following cells to focus entirely on retrieving and processing financial data without repeating connection details.
CELL 3 — Create an API Request Function with Fallback Support
def fetch_api(name, endpoint):
    url = BASE_URL + endpoint

    try:
        response = requests.get(url, headers=HEADERS, timeout=20)
        print(f"\nEndpoint: {endpoint}")
        print(f"Status Code: {response.status_code}")

        if response.status_code == 200:
            print(f"✅ Berhasil mengambil data: {name}")
            return response.json()

        elif response.status_code == 403:
            print("⚠️ API menolak akses: akun RapidAPI belum subscribe ke API ini.")

        elif response.status_code == 429:
            print("⚠️ Terlalu banyak request. Tunggu beberapa menit atau gunakan sample data.")

        else:
            print("❌ Gagal mengambil data")
            print(response.text)

    except Exception as e:
        print(f"❌ Error request API: {e}")

    return None
Explanation
After configuring the API connection, the notebook creates a reusable function named fetch_api() that is responsible for retrieving data from the Indonesia Stock Exchange API.
Instead of writing nearly identical request code for every endpoint, the notebook centralizes the communication process inside a single function. This approach keeps the notebook cleaner and makes future maintenance much easier because every API request follows the same workflow.
The function accepts two parameters: name, which identifies the dataset being requested, and endpoint, which specifies the API route. These parameters are combined with the previously defined BASE_URL to construct the complete request URL.
Using the requests.get() method, the function sends an HTTP GET request while including the authentication headers created in the previous cell. A timeout of twenty seconds is also specified to prevent the notebook from waiting indefinitely if the API becomes unavailable.
Once the request has been sent, the notebook prints both the endpoint being accessed and the returned HTTP status code. These messages provide immediate feedback during execution and make troubleshooting much easier whenever an API request fails.
The function then evaluates the response status.
If the API returns HTTP 200, the request is considered successful. A confirmation message is displayed, and the JSON response is returned to the caller.
If the response is HTTP 403, the notebook informs the user that the RapidAPI account does not have access to the requested endpoint. This commonly occurs when the API subscription has not yet been activated.
If the response is HTTP 429, the notebook explains that too many requests have been sent within a short period. Instead of terminating the workflow, the function simply returns None, allowing the notebook to continue using fallback data in the following cell.
Any unexpected status codes are also handled gracefully by printing both an error message and the raw response body. Finally, a general exception handler captures connection problems or network-related errors, preventing the notebook from stopping unexpectedly.
By returning None whenever the API request cannot be completed, the function prepares the notebook for the fallback mechanism implemented in the next section.
CELL 4 — Retrieve Data from the API and Apply Fallback Sample Data
today_actions = fetch_api(
    "Today Corporate Actions",
    endpoints["Today Corporate Actions"]
)

forex_impact = fetch_api(
    "Forex IDR Impact",
    endpoints["Forex IDR Impact"]
)

if today_actions is None:
    today_actions = [
        {"ticker": "BBCA", "action": "Dividend", "date": str(datetime.today().date())},
        {"ticker": "TLKM", "action": "RUPS", "date": str(datetime.today().date())},
        {"ticker": "ADRO", "action": "Cum Date", "date": str(datetime.today().date())}
    ]
    print("✅ Menggunakan sample data untuk Corporate Actions.")

if forex_impact is None:
    forex_impact = [
        {"currency": "USD/IDR", "impact": "High", "change": 0.45},
        {"currency": "EUR/IDR", "impact": "Medium", "change": -0.21},
        {"currency": "JPY/IDR", "impact": "Low", "change": 0.10}
    ]
    print("✅ Menggunakan sample data untuk Forex IDR Impact.")
Explanation
Once the reusable request function has been created, the notebook retrieves data from the two API endpoints defined earlier.
The first request accesses the Today Corporate Actions endpoint. This endpoint returns information about corporate actions scheduled for the current day, including activities such as dividend distributions, annual shareholder meetings (RUPS), and cum dates.
The second request retrieves data from the Forex IDR Impact endpoint. Unlike the corporate action dataset, this endpoint focuses on the impact of movements in the Indonesian Rupiah exchange rate against major foreign currencies.
Rather than assuming that both API requests will always succeed, the notebook immediately checks whether either request returned None. This indicates that the request failed due to subscription restrictions, rate limiting, network issues, or other unexpected errors.
If the Today Corporate Actions dataset is unavailable, the notebook automatically generates a small sample dataset containing three representative corporate actions. Each sample record includes a stock ticker, the type of corporate action, and the current execution date generated with datetime.today().date().
A similar fallback mechanism is implemented for the Forex IDR Impact dataset. When the live API response cannot be retrieved, the notebook creates sample data representing three foreign currencies together with their respective impact levels and percentage changes.
This fallback strategy is particularly useful during development and demonstrations. Instead of interrupting the workflow whenever the API is unavailable, the notebook continues executing normally using predefined sample data that closely resembles the structure of the live API response.
As a result, the remaining sections of the notebook—including data transformation, summary generation, and visualization—can be executed without modification regardless of whether the data originates from the live API or from the fallback datasets
CELL 5 — Display Data and Create a Simple Visualization
print("=== Today Corporate Actions ===")

corporate_data = today_actions.get("data", {}) if isinstance(today_actions, dict) else {}
actions_list = []

for action_type, items in corporate_data.items():
    if isinstance(items, list):
        for item in items:
            row = item.copy()
            row["action_type"] = action_type
            actions_list.append(row)

df_actions = pd.DataFrame(actions_list)

if df_actions.empty:
    print("Tidak ada corporate action hari ini.")
else:
    display(df_actions)


print("\n=== Forex IDR Impact ===")

forex_data = forex_impact.get("data", {}) if isinstance(forex_impact, dict) else forex_impact
df_forex = pd.json_normalize(forex_data)

display(df_forex)

def get_col(df, possible_cols):
    for col in possible_cols:
        if col in df.columns:
            return df[col].iloc[0]
    return None

symbol = get_col(df_forex, ["forex.symbol", "forex.forex.symbol"])
name = get_col(df_forex, ["forex.name", "forex.forex.name"])
price = get_col(df_forex, ["forex.price", "forex.forex.price"])
change = get_col(df_forex, ["forex.change", "forex.forex.change"])
change_percent = get_col(df_forex, ["forex.changePercent", "forex.forex.changePercent"])
idr_strengthening = get_col(df_forex, ["idrStrengthening", "forex.idrStrengthening"])
current_beneficiary = get_col(df_forex, ["currentBeneficiary", "forex.currentBeneficiary"])

print("\nRingkasan:")
print(f"Symbol : {symbol}")
print(f"Name : {name}")
print(f"Harga USD/IDR : {price}")
print(f"Change : {change}")
print(f"Change Percent : {change_percent}%")
print(f"IDR Strengthening : {idr_strengthening}")
print(f"Current Beneficiary : {current_beneficiary}")

if change_percent is not None:
    plt.figure(figsize=(6, 4))
    plt.bar(["USD/IDR"], [change_percent])
    plt.title("Forex IDR Impact - Change Percent")
    plt.ylabel("Change (%)")
    plt.grid(axis="y", linestyle="--", alpha=0.5)
    plt.show()
else:
    print("Data change percent tidak ditemukan.")
Explanation
The final section combines the retrieved datasets into a simple dashboard that displays Today's Corporate Actions together with the Forex IDR Impact information.
The notebook begins by processing the Today Corporate Actions response. Because the API returns multiple categories of corporate actions inside a nested dictionary, the code first extracts the data section when the response is returned as a dictionary. An empty list named actions_list is then prepared to collect every corporate action into a single structure.
Next, the notebook iterates through each corporate action category. Every item inside the category is copied into a new dictionary before an additional field named action_type is added. This preserves the original information while recording the category from which each record originates. After every record has been collected, the notebook converts the list into a pandas DataFrame named df_actions.
The DataFrame is then displayed to the user. If no corporate actions are available for the current day, the notebook prints a message indicating that there are no scheduled corporate actions instead of displaying an empty table.
The second part of the cell focuses on the Forex IDR Impact dataset. Similar to the previous section, the notebook first checks whether the API response is stored as a dictionary. The nested JSON structure is then flattened using pd.json_normalize(), producing a DataFrame named df_forex. Flattening the response simplifies access to deeply nested fields and allows the notebook to work with a tabular representation of the data.
To improve compatibility with different API response structures, the notebook defines a helper function named get_col(). Rather than assuming that a specific column name always exists, the function searches several possible column names and returns the first matching value. This makes the notebook more flexible if the API slightly changes its response format.
Using this helper function, the notebook extracts several important pieces of information, including the forex symbol, currency name, current exchange rate, daily change, percentage change, IDR strengthening status, and the current beneficiary. These values are then printed as a concise summary, giving users a quick overview of the USD/IDR market condition without having to inspect the entire DataFrame.
Finally, the notebook creates a simple bar chart when the percentage change value is available. The visualization displays the USD/IDR Change Percent, making it easier to interpret the movement at a glance. If the percentage value cannot be found, the notebook prints a warning message instead of attempting to generate an incomplete chart.
Although the visualization is intentionally simple, it effectively demonstrates how financial data retrieved from an API can be transformed into a graphical representation using Matplotlib.
Result
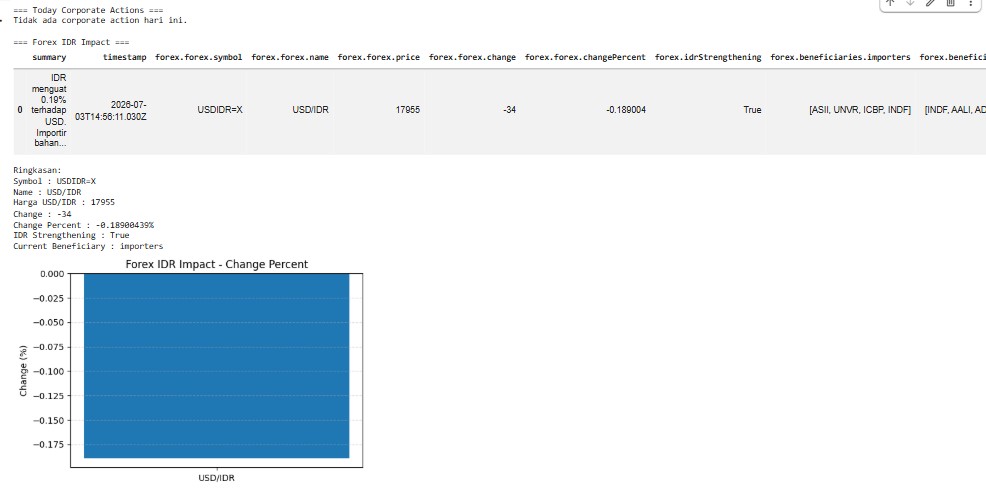
Today Corporate Actions
The first output of the notebook is the Today Corporate Actions table.
After retrieving data from the Indonesia Stock Exchange API, the notebook restructures every available corporate action into a single pandas DataFrame. Each record includes its corresponding corporate action category through the additional action_type column, allowing users to identify whether an event represents a dividend announcement, a shareholder meeting, a cum date, or another type of corporate action.
If no corporate actions are scheduled for the current day, the notebook displays a simple notification instead of presenting an empty table.
Forex IDR Impact
The second output displays the Forex IDR Impact dataset.
The notebook normalizes the nested API response into a structured DataFrame before extracting the most important fields. It then presents a concise summary that includes the currency symbol, exchange rate, daily change, percentage change, IDR strengthening status, and the market participant currently benefiting from the exchange rate movement.
This summary allows users to understand the current USD/IDR condition without manually exploring the JSON response.
Forex Visualization
To complement the textual summary, the notebook generates a simple bar chart representing the USD/IDR percentage change.
Although the visualization contains only a single value, it demonstrates how financial indicators retrieved from an API can be visualized quickly using Matplotlib. This chart can later serve as the foundation for more advanced dashboards containing multiple currencies or historical trends.
Overall Workflow
The notebook follows a straightforward workflow that transforms raw API responses into structured information and a simple visualization.
Import the required Python libraries.
Configure the Indonesia Stock Exchange API connection through RapidAPI.
Create a reusable function for API requests.
Retrieve Today Corporate Actions data.
Retrieve Forex IDR Impact data.
Apply fallback sample data when API requests fail.
Convert Today Corporate Actions into a pandas DataFrame.
Normalize the Forex IDR Impact response into a DataFrame.
Display a summary of the forex information.
Visualize the USD/IDR percentage change using Matplotlib.
Why This Project Matters
Financial information changes continuously throughout the trading day. Accessing this information manually from multiple sources can be time-consuming and inefficient, particularly for investors or developers who need consistent and structured market data.
This project demonstrates a simple yet practical workflow for retrieving financial information directly from the Indonesia Stock Exchange API using Python. Rather than focusing on complex analytics, the notebook emphasizes reliable data retrieval, structured presentation, graceful error handling, and basic visualization.
Another strength of the project is its fallback mechanism. When the API is unavailable due to subscription limitations or request limits, predefined sample data allows the notebook to continue running without interrupting the workflow. This makes the project suitable not only for production environments but also for demonstrations, tutorials, and experimentation.
By combining Today's Corporate Actions with Forex IDR Impact data in a single notebook, users can monitor two important aspects of the Indonesian financial market using a concise and easy-to-understand Python workflow.
Conclusion
The Today Corporate Actions and Forex IDR Impact Dashboard demonstrates how Python can be used to retrieve, process, summarize, and visualize financial market information from the Indonesia Stock Exchange API.
Using requests, pandas, and Matplotlib, the notebook retrieves data from two API endpoints, handles possible API failures through fallback sample data, converts nested JSON responses into structured DataFrames, and presents a simple visualization of the USD/IDR percentage change.
Although intentionally lightweight, this project provides a solid foundation for building more advanced financial dashboards, integrating additional market indicators, or expanding the workflow into automated market monitoring and reporting applications.