
Pump-and-dump activity is one of the market behaviors that investors frequently monitor when evaluating unusual price movements. Identifying potential pump-and-dump patterns together with institutional accumulation activity can provide additional context before making investment decisions.
The Indonesia Stock Exchange API provides dedicated endpoints that allow developers to retrieve Pump Dump Detection and Bandar Accumulation information programmatically. Instead of checking multiple reports manually, Python can automate the retrieval process and organize the returned information into structured datasets.
In this tutorial, we build a Pump Dump Detection and Bandar Accumulation Dashboard using Python and the Indonesia Stock Exchange API. The notebook retrieves Pump Dump Detection data together with Bandar Accumulation information for a selected stock, converts both API responses into pandas DataFrames, displays structured outputs, summarizes the analysis, and finishes with a concise project conclusion.
The notebook consists of five sequential sections that cover API configuration, request handling, DataFrame conversion, analysis summary, and project conclusion.
What This Project Builds
This notebook builds a lightweight market analysis dashboard capable of retrieving two analysis datasets from the Indonesia Stock Exchange API.
The completed workflow includes:
Pump Dump Detection retrieval
Bandar Accumulation retrieval
RapidAPI integration
API error handling
Sample data fallback
pandas DataFrame conversion
Structured analysis summary
Project conclusion
Rather than predicting stock prices, the notebook focuses on retrieving market analysis data and presenting the returned information in a clean, structured format for further review.
CELL 1 — Import & Configuration
import requests
import pandas as pd

API_KEY = "YOUR_API_KEY"

BASE_URL = "https://indonesia-stock-exchange-idx.p.rapidapi.com"

HEADERS = {
    "x-rapidapi-key": API_KEY,
    "x-rapidapi-host": "indonesia-stock-exchange-idx.p.rapidapi.com",
    "Content-Type": "application/json"
}

STOCK = "BUMI"

PUMP_DUMP_DAYS = 14
ACCUMULATION_DAYS = 30
Note: Replace the original API key with
YOUR_API_KEYbefore publishing the notebook or sharing the source code publicly.
Explanation
The notebook begins by importing the Python libraries required throughout the project. Only two libraries are needed because the workflow focuses on retrieving API data and converting the responses into structured tables.
The requests library is responsible for communicating with the Indonesia Stock Exchange API through RapidAPI. Every API request performed later in the notebook uses this library to retrieve Pump Dump Detection and Bandar Accumulation information.
After receiving the API responses, the notebook uses pandas to organize the returned JSON objects into DataFrames. Converting the responses into tabular structures makes the analysis easier to read and inspect compared to working directly with nested JSON objects.
The second part of this cell prepares the API configuration. The notebook stores the authentication key inside the API_KEY variable, defines the base URL for the Indonesia Stock Exchange API, and creates the request headers required for every API call.
Finally, the notebook defines three important parameters that will be reused throughout the project. The selected stock symbol is BUMI, Pump Dump Detection is retrieved for the most recent 14 days, while Bandar Accumulation uses a 30-day observation period. Keeping these parameters in one place makes the notebook easier to maintain and modify whenever different stocks or time periods need to be analyzed.
CELL 2 — Create the API Request Function
def get_json(endpoint, sample_data=None):
    url = BASE_URL + endpoint

    try:
        r = requests.get(url, headers=HEADERS, timeout=30)

        print(f"\nEndpoint: {endpoint}")
        print("Status:", r.status_code)

        r.raise_for_status()
        return r.json()

    except requests.exceptions.HTTPError:
        if r.status_code == 403:
            print("⚠️ API belum disubscribe.")
        elif r.status_code == 429:
            print("⚠️ Rate limit tercapai. Menggunakan sample data.")
        else:
            print(r.text)

        return sample_data

    except Exception as e:
        print(e)
        return sample_data


sample_accumulation = {
    "success": True,
    "data": {
        "symbol": STOCK,
        "company_name": STOCK,
        "period_days": ACCUMULATION_DAYS,
        "status": "SAMPLE_DATA",
        "accumulation_signal": "WAIT",
        "net_accumulation": 0,
        "confidence": 0,
        "note": "Sample data digunakan karena API terkena rate limit 429."
    }
}

pump_dump = get_json(
    f"/api/analysis/bandar/pump-dump/{STOCK}?days={PUMP_DUMP_DAYS}"
)

accumulation = get_json(
    f"/api/analysis/bandar/accumulation/{STOCK}?days={ACCUMULATION_DAYS}",
    sample_data=sample_accumulation
)
Explanation
The second section creates a reusable helper function named get_json() that is responsible for retrieving data from the Indonesia Stock Exchange API.
Instead of repeating the same request logic for every endpoint, the notebook centralizes the communication process into a single function. This approach simplifies the code and makes it easier to reuse whenever additional API endpoints need to be integrated.
The function begins by combining the previously defined base URL with the endpoint provided as an argument. It then sends an HTTP GET request using the configured request headers and waits for the API response.
To improve transparency during execution, the notebook prints both the requested endpoint and the returned HTTP status code. These messages help users verify which endpoint is being accessed and quickly identify whether the request has completed successfully.
One of the strengths of this implementation is its built-in error handling. If the API returns HTTP 403, the notebook informs the user that the endpoint has not been subscribed to. When HTTP 429 is encountered, indicating that the request limit has been exceeded, the notebook automatically falls back to predefined sample data instead of terminating the workflow.
The notebook also defines a sample Bandar Accumulation response that closely resembles the structure of the real API. This fallback mechanism allows the remaining analysis to continue even when the live API is temporarily unavailable.
Finally, the helper function retrieves two datasets. The first request obtains Pump Dump Detection information for the selected stock, while the second retrieves Bandar Accumulation data using the predefined observation period. Both requests use the same helper function, demonstrating how reusable code simplifies communication with multiple API endpoints.
CELL 3 — Convert API Responses into DataFrames
print("\n=== Pump Dump Detection ===")

if pump_dump:
    df_pump = pd.json_normalize(pump_dump if isinstance(pump_dump, list) else [pump_dump])
    display(df_pump)
else:
    df_pump = pd.DataFrame()
    print("Tidak ada data.")


print("\n=== Bandar Accumulation ===")

print("Raw accumulation response:")
print(accumulation)

if accumulation:
    if isinstance(accumulation, list):
        df_acc = pd.json_normalize(accumulation)
    elif isinstance(accumulation, dict):
        if "data" in accumulation:
            df_acc = pd.json_normalize(
                accumulation["data"]
                if isinstance(accumulation["data"], list)
                else [accumulation["data"]]
            )
        else:
            df_acc = pd.json_normalize([accumulation])
    else:
        df_acc = pd.DataFrame()

    display(df_acc)
else:
    df_acc = pd.DataFrame()
    print("Tidak ada data.")
Explanation
After retrieving the API responses, the notebook converts both datasets into pandas DataFrames so the information can be presented in a structured and readable format.
The first section processes the Pump Dump Detection response. When data is available, the notebook uses pd.json_normalize() to flatten the JSON response before converting it into a DataFrame. This method works whether the API returns a single dictionary or a list of dictionaries, ensuring that the resulting table remains consistent regardless of the response format.
If no Pump Dump Detection data is returned, the notebook creates an empty DataFrame and displays a simple notification informing the user that no data is available. This prevents runtime errors while keeping the notebook output easy to understand.
The second section performs the same conversion process for Bandar Accumulation data. Before transforming the response into a DataFrame, the notebook first prints the raw API response. Displaying the original response makes debugging easier because users can immediately inspect the JSON structure whenever unexpected results occur.
Because the Bandar Accumulation endpoint may return different JSON structures, the notebook performs additional validation. If the response is a list, it is normalized directly. If the response is a dictionary containing a data field, only the contents of that field are normalized. Otherwise, the entire dictionary is converted into a single-row DataFrame.
By supporting multiple response formats, the notebook remains flexible even if the API structure changes slightly in the future. Once the conversion is complete, the resulting DataFrame is displayed, allowing users to inspect the retrieved Pump Dump Detection and Bandar Accumulation information in tabular form.
CELL 4 — Analysis Summary
print("="*60)
print("RINGKASAN")
print("="*60)

# Pump Dump
if not df_pump.empty:

    print("\nPump Dump Detection")

    for col in df_pump.columns:
        print(f"{col} : {df_pump.iloc[0][col]}")

else:
    print("\nPump Dump Detection : Tidak ada data")


# Accumulation
if not df_acc.empty:

    print("\nBandar Accumulation")

    for col in df_acc.columns:
        print(f"{col} : {df_acc.iloc[0][col]}")

else:
    print("\nBandar Accumulation : Tidak ada data")
Explanation
Once both datasets have been converted into DataFrames, the notebook generates a text-based summary of the analysis results.
Instead of displaying the DataFrames again, this section focuses on presenting every available field in a concise format. This makes it easier to review the retrieved information without scanning an entire table.
The summary begins with the Pump Dump Detection dataset. If the DataFrame contains data, the notebook iterates through every available column and prints the corresponding value from the first record. This approach automatically adapts to the API response because it does not rely on predefined column names. Any new fields introduced by the API will automatically appear in the summary without requiring modifications to the code.
If no Pump Dump Detection data is available, the notebook prints a simple notification indicating that no analysis could be performed.
The same workflow is then applied to the Bandar Accumulation dataset. When data exists, every column and its corresponding value from the first record are displayed sequentially. If the DataFrame is empty, the notebook clearly informs the user that no Bandar Accumulation data was retrieved.
This dynamic reporting approach keeps the notebook flexible while providing a comprehensive overview of the information returned by the Indonesia Stock Exchange API.
CELL 5 — Project Conclusion
print("="*60)
print("KESIMPULAN")
print("="*60)

# Pump Dump
if not df_pump.empty:

    print("\n📈 Pump Dump Detection berhasil diperoleh.")
    print(f"Total field : {len(df_pump.columns)}")

else:

    print("\n📈 Tidak ada data Pump Dump.")


# Accumulation
if not df_acc.empty:

    print("\n💰 Bandar Accumulation berhasil diperoleh.")
    print(f"Total field : {len(df_acc.columns)}")

else:

    print("\n💰 Tidak ada data Bandar Accumulation.")


print("\nProject selesai.")
Explanation
The final section concludes the workflow by presenting a concise project summary based on the processed datasets.
Rather than repeating the complete analysis, the notebook verifies whether each DataFrame contains data before generating the final output. This provides a quick confirmation that the previous steps have successfully retrieved and processed the API responses.
The notebook first evaluates the Pump Dump Detection DataFrame. When data is available, it displays a confirmation message indicating that the Pump Dump Detection analysis has been retrieved successfully. It also prints the total number of fields contained in the DataFrame, providing a simple overview of the amount of information returned by the API.
If the DataFrame is empty, the notebook informs the user that no Pump Dump Detection data is available. This prevents misleading conclusions when the API response is empty or unavailable.
The same validation process is repeated for the Bandar Accumulation DataFrame. When the DataFrame contains records, the notebook confirms that the accumulation analysis has been retrieved successfully and reports the total number of available fields. Otherwise, a notification explains that no Bandar Accumulation data was returned.
Finally, the notebook prints Project selesai, signaling that every step of the workflow—from API configuration to data retrieval, conversion, analysis, and reporting—has completed successfully.
Unlike many analytical notebooks that perform additional calculations in the final stage, this project intentionally keeps the conclusion simple. Its purpose is to verify that both datasets have been processed correctly before the notebook terminates.
Result
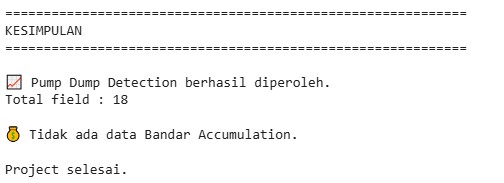
The notebook produces two primary analytical outputs retrieved from the Indonesia Stock Exchange API: Pump Dump Detection and Bandar Accumulation.
Pump Dump Detection
The first output displays Pump Dump Detection information for the selected stock symbol.
After retrieving the API response, the notebook converts the returned JSON object into a pandas DataFrame using pd.json_normalize(). This allows every field returned by the API to be displayed in a structured table instead of a nested JSON object.
The notebook then generates a detailed summary by printing every available field from the first record. This dynamic approach ensures that newly added API fields will automatically appear without requiring code modifications.
If no data is returned, the notebook displays an informative message instead of producing an error.
Bandar Accumulation
The second output presents Bandar Accumulation data for the same stock symbol.
Before converting the response into a DataFrame, the notebook prints the raw API response to help users inspect the returned JSON structure. It then normalizes the response and displays the resulting DataFrame.
Similar to Pump Dump Detection, the notebook prints every available field from the first record during the summary stage, making it easy to review the retrieved information without manually inspecting the DataFrame.
When the API returns no data, the notebook clearly reports that the Bandar Accumulation dataset is unavailable.
Final Project Summary
The final output verifies that both analytical datasets have been processed successfully.
Instead of repeating the retrieved values, the notebook confirms whether each DataFrame contains data and reports the total number of available fields. This provides a simple validation step before the notebook completes execution.
The workflow concludes by printing Project selesai, indicating that the complete retrieval and analysis process has finished successfully.
Overall Workflow
The notebook follows a simple and organized workflow for retrieving market analysis data from the Indonesia Stock Exchange API.
Import the required Python libraries.
Configure RapidAPI authentication and analysis parameters.
Create a reusable API request function with built-in error handling.
Retrieve Pump Dump Detection data.
Retrieve Bandar Accumulation data.
Apply fallback sample data when API rate limits occur.
Convert API responses into pandas DataFrames.
Display structured tables for both datasets.
Generate a complete field-by-field analysis summary.
Display the final project conclusion.
Why This Project Matters
Pump Dump Detection and Bandar Accumulation provide valuable market analysis information that can help investors understand unusual trading activity and institutional participation.
Instead of collecting this information manually from multiple sources, this notebook demonstrates how Python can automate the retrieval process using the Indonesia Stock Exchange API. The workflow handles API communication, manages common request errors, converts complex JSON responses into structured DataFrames, and presents the information in a readable format.
Another practical feature of this project is the fallback mechanism used for Bandar Accumulation. When the API reaches the request limit, predefined sample data allows the notebook to continue executing without interrupting the remaining workflow. This makes the project suitable for demonstrations, educational purposes, and development environments where API availability may vary.
Because the notebook separates configuration, API communication, data transformation, summary generation, and project validation into individual sections, it also provides a clean foundation for building more advanced financial analysis applications in the future.
Conclusion
The Pump Dump Detection and Bandar Accumulation Dashboard demonstrates how Python can be used to retrieve, organize, and summarize market analysis data from the Indonesia Stock Exchange API.
Using requests and pandas, the notebook retrieves Pump Dump Detection and Bandar Accumulation information, handles API responses through a reusable request function, converts the returned JSON objects into structured DataFrames, and produces a comprehensive summary of every available field.
Although intentionally lightweight, the project provides a practical starting point for developers, analysts, and investors who want to automate market analysis workflows using the Indonesia Stock Exchange API. Its modular structure also makes it easy to extend with additional endpoints, visualizations, or reporting features in future projects.