
Finding high-potential stocks before significant price movements is one of the primary objectives of many investors. Two market analysis datasets that help support this process are Multibagger Scan and Breakout Alerts. While Multibagger Scan identifies stocks with strong long-term growth potential based on predefined criteria, Breakout Alerts highlight stocks showing technical breakout signals that may deserve closer attention.
Instead of reviewing these opportunities manually every trading session, Python can automate the process by retrieving both datasets directly from the Indonesia Stock Exchange API. Once the data is available, it can be transformed into structured tables and summarized for faster analysis.
In this tutorial, we build a Multibagger Scan and Breakout Alerts Dashboard using Python and the Indonesia Stock Exchange API. The notebook retrieves Multibagger Scan candidates from the Energy sector together with the latest Breakout Alerts, converts the returned JSON responses into pandas DataFrames, summarizes the strongest candidates, and generates a compact statistical overview.
The notebook consists of five sequential sections covering API configuration, data retrieval, data presentation, summary analysis, and statistical reporting.
What This Project Builds
This notebook builds a lightweight dashboard for monitoring retail market opportunities from two analysis endpoints provided by the Indonesia Stock Exchange API.
The completed workflow includes:
Multibagger Scan retrieval
Breakout Alerts retrieval
RapidAPI integration
JSON response handling
pandas DataFrame conversion
Candidate ranking
Market summary
Statistical reporting
Rather than predicting future stock prices, the notebook focuses on retrieving and organizing market screening results so they can be reviewed more efficiently.
CELL 1 — Import & Configuration
import requests
import pandas as pd

API_KEY = "YOUR_API_KEY"

HEADERS = {
    "Content-Type": "application/json",
    "x-rapidapi-key": API_KEY,
    "x-rapidapi-host": "indonesia-stock-exchange-idx.p.rapidapi.com"
}

BASE_URL = "https://indonesia-stock-exchange-idx.p.rapidapi.com"
Note: Replace the original API key with
YOUR_API_KEYbefore publishing the notebook publicly.
Explanation
The notebook begins by importing the libraries required for the project.
The requests library is responsible for communicating with the Indonesia Stock Exchange API through RapidAPI. Every request performed later in the notebook uses this library to retrieve market screening data.
The notebook also imports pandas, which converts the returned JSON responses into structured DataFrames. Organizing the API responses into tabular structures makes the retrieved information easier to inspect and summarize.
The remainder of this cell prepares the API configuration. The authentication key is stored inside the API_KEY variable, while the required HTTP headers are grouped into the HEADERS dictionary. Finally, the notebook defines the base URL of the Indonesia Stock Exchange API, allowing every request in the following cells to reuse the same configuration instead of repeating it multiple times.
CELL 2 — Retrieve Data from the API
def get_api(endpoint):
    url = BASE_URL + endpoint

    try:
        r = requests.get(url, headers=HEADERS, timeout=30)

        print(f"\nEndpoint : {endpoint}")
        print("Status   :", r.status_code)

        if r.status_code == 200:
            return r.json()

        elif r.status_code == 429:
            print("⚠️ Rate Limit tercapai.")
            return None

        elif r.status_code == 403:
            print("⚠️ Endpoint tidak dapat diakses.")
            return None

        else:
            print(r.text)
            return None

    except Exception as e:
        print(e)
        return None


multibagger = get_api(
    "/api/analysis/retail/multibagger/scan?sector=Energy&min_score=50&max_results=20"
)

breakout = get_api(
    "/api/analysis/retail/breakout/alerts"
)
Explanation
The second section retrieves market analysis data from two retail analysis endpoints provided by the Indonesia Stock Exchange API.
The notebook begins by defining a reusable helper function named get_api(). Instead of writing separate request logic for every endpoint, this function centralizes the communication process into a single reusable component. This approach improves readability while making future maintenance easier.
Each request starts by combining the predefined base URL with the selected endpoint. The notebook then sends an HTTP GET request using the authentication headers configured in the previous section.
To provide execution feedback, the notebook prints both the endpoint being requested and the returned HTTP status code. These messages make it easier to identify successful requests as well as API errors during execution.
The helper function also includes basic error handling. When the API returns HTTP 429, indicating that the request limit has been exceeded, the notebook reports the rate limit and returns None. If the API responds with HTTP 403, the notebook informs the user that the requested endpoint cannot be accessed. Other unexpected responses are printed directly to assist with troubleshooting.
After defining the helper function, the notebook performs two API requests. The first retrieves Multibagger Scan candidates from the Energy sector using a minimum score of fifty and limiting the response to twenty results. The second request retrieves the latest Breakout Alerts, providing another dataset that complements the multibagger screening process.
CELL 3 — Display Data
print("\n========== MULTIBAGGER SCAN ==========")

if multibagger:

    df_multi = pd.json_normalize(multibagger["data"])

    display(df_multi)

else:
    print("Tidak ada data.")


print("\n========== BREAKOUT ALERTS ==========")

if breakout:

    df_break = pd.json_normalize(breakout["data"])

    display(df_break)

else:
    print("Tidak ada data.")
Explanation
Once both API requests have been completed, the notebook converts the returned JSON responses into pandas DataFrames for easier inspection.
The first section displays the Multibagger Scan results. If the API successfully returns data, the notebook extracts the data field and uses pd.json_normalize() to flatten the JSON structure into a structured DataFrame. This transformation makes every candidate easier to review because each stock appears as a separate row with its associated attributes presented as columns.
The resulting DataFrame is then rendered directly inside the notebook using the display() function. If the API does not return any data, the notebook prints a simple notification indicating that no records are available.
The second section performs exactly the same workflow for Breakout Alerts. The notebook normalizes the response into another DataFrame before displaying the available breakout candidates.
Separating both datasets into individual DataFrames improves readability and prepares the information for the summary analysis performed in the next section.
CELL 4 — Summary Analysis
print("="*70)
print("RINGKASAN ANALISIS")
print("="*70)

def ambil_list_data(json_data):
    if not json_data:
        return []

    data = json_data.get("data", json_data)

    if isinstance(data, list):
        return data

    if isinstance(data, dict):
        for key in ["results", "stocks", "items", "candidates", "alerts", "data"]:
            if key in data and isinstance(data[key], list):
                return data[key]

        return [data]

    return []


multi_list = ambil_list_data(multibagger)
break_list = ambil_list_data(breakout)


print("\nTOP MULTIBAGGER\n")

if multi_list:
    for i, item in enumerate(multi_list[:10], 1):
        symbol = item.get("symbol", "-")
        company = item.get("company_name", item.get("company", "-"))
        score = item.get("score", item.get("multibagger_score", "-"))
        sector = item.get("sector", "-")

        print(f"{i}. {symbol:8} Score: {score} | {company} | {sector}")
else:
    print("Data Multibagger tidak tersedia.")


print("\n" + "-"*70)
print("\nBREAKOUT ALERTS\n")

if break_list:
    for i, item in enumerate(break_list[:10], 1):
        symbol = item.get("symbol", "-")
        status = item.get("status", "-")
        signal = item.get("signal", item.get("alert_type", "-"))
        strength = item.get("strength", item.get("score", "-"))

        print(f"{i}. {symbol:8} {signal} | {status} | Strength: {strength}")
else:
    print("Data Breakout tidak tersedia.")
Explanation
After presenting the raw datasets, the notebook generates a concise market summary.
The first step defines a helper function named ambil_list_data(). Because API responses may have slightly different structures depending on the endpoint, this function standardizes the response by extracting the list containing the actual records. If the response already contains a list, it is returned immediately. If the response is a dictionary, the function searches several commonly used keys such as results, stocks, items, candidates, alerts, and data before returning the appropriate collection.
Using this helper function, the notebook extracts two standardized lists: one containing the Multibagger Scan candidates and another containing the Breakout Alerts.
The notebook then displays the Top Multibagger candidates. For each record, it retrieves the stock symbol, company name, multibagger score, and sector before printing a formatted summary. Only the first ten candidates are displayed, keeping the output compact while still highlighting the strongest opportunities returned by the API.
The second part of the summary focuses on Breakout Alerts. Similar to the Multibagger section, the notebook iterates through the first ten breakout candidates and prints the stock symbol, breakout signal, current status, and signal strength.
Rather than displaying the entire DataFrame again, this summary provides a quick overview of the most relevant information. Investors can immediately review the leading Multibagger candidates together with the strongest Breakout Alerts without manually scanning every available column.
CELL 5 — Statistics
print("="*70)
print("📊 STATISTIK RINGKAS")
print("="*70)

multi_list = ambil_list_data(multibagger)
break_list = ambil_list_data(breakout)

print(f"""
🚀 MULTIBAGGER SCAN
━━━━━━━━━━━━━━━━━━━━━━━━━━━━━━━━━━━━
Total Kandidat     : {len(multi_list)}
Sector             : Energy
Minimal Score      : 50
Status Data        : {'Tersedia ✅' if multi_list else 'Kosong ❌'}
""")

print(f"""
📈 BREAKOUT ALERTS
━━━━━━━━━━━━━━━━━━━━━━━━━━━━━━━━━━━━
Total Alert        : {len(break_list)}
Status Data        : {'Tersedia ✅' if break_list else 'Kosong ❌'}
""")

if multi_list:
    print("🏆 TOP KANDIDAT MULTIBAGGER")
    print("━━━━━━━━━━━━━━━━━━━━━━━━━━━━━━━━━━━━")

    for i, item in enumerate(multi_list[:5], 1):
        symbol = item.get("symbol", "-")
        score = item.get("score", item.get("multibagger_score", "-"))
        company = item.get("company_name", item.get("company", "-"))

        print(f"{i}. {symbol} | Score: {score} | {company}")

if break_list:
    print("\n🔥 TOP BREAKOUT ALERT")
    print("━━━━━━━━━━━━━━━━━━━━━━━━━━━━━━━━━━━━")

    for i, item in enumerate(break_list[:5], 1):
        symbol = item.get("symbol", "-")
        signal = item.get("signal", item.get("alert_type", "-"))
        strength = item.get("strength", item.get("score", "-"))

        print(f"{i}. {symbol} | Signal: {signal} | Strength: {strength}")
Explanation
The final cell produces a compact statistical summary of the retrieved Multibagger Scan and Breakout Alerts data.
The notebook begins by printing a formatted title named STATISTIK RINGKAS, making the final output visually separate from the earlier analysis section.
It then calls the ambil_list_data() helper function again for both datasets. This ensures that the Multibagger Scan response and the Breakout Alerts response are converted into clean list structures before the statistics are calculated.
The first summary block focuses on Multibagger Scan. It displays the total number of candidates, the selected sector, the minimum score used in the API request, and the current data status. The sector is shown as Energy, while the minimum score is set to 50, matching the parameters used in Cell 2.
The second summary block focuses on Breakout Alerts. It displays the total number of alerts and whether the dataset is available or empty.
If Multibagger Scan data exists, the notebook prints the top five candidates. For each candidate, it displays the stock symbol, score, and company name. This gives users a short list of the highest-priority candidates without displaying the entire dataset again.
If Breakout Alerts data exists, the notebook prints the top five breakout alerts. Each row includes the stock symbol, signal type, and strength value.
This final cell does not introduce new calculations beyond counting records and printing selected fields. Its purpose is to make the notebook output easier to review by presenting the most important information in a concise text format.
Result
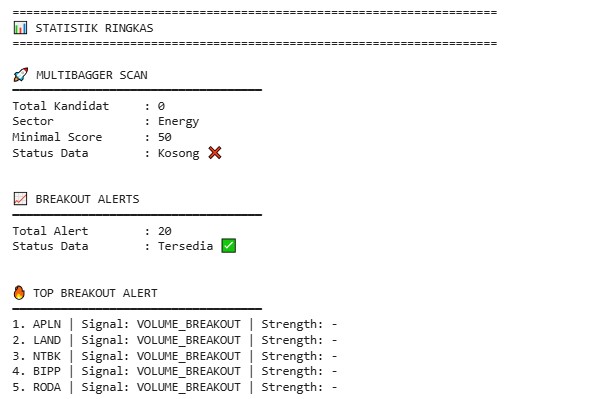
The completed notebook produces three main outputs: Multibagger Scan, Breakout Alerts, and Statistical Summary.
Multibagger Scan Output
The first output displays Multibagger Scan data retrieved from the Indonesia Stock Exchange API.
The notebook requests Energy sector candidates with a minimum score of 50 and a maximum result limit of 20. If the API response is available, the data field is normalized into a pandas DataFrame and displayed in tabular format.
The summary section then prints the top Multibagger candidates, including each stock symbol, score, company name, and sector when available.
Breakout Alerts Output
The second output displays Breakout Alerts data.
The notebook retrieves the latest breakout alert response from the API, normalizes the data field into a pandas DataFrame, and displays the available records.
The summary section prints up to ten breakout alerts, including each stock symbol, signal type, status, and strength value.
Statistical Summary Output
The final output presents a compact statistical overview.
It displays the total number of Multibagger candidates, selected sector, minimum score, data availability status, total number of Breakout Alerts, and the top five records from each dataset when available.
This makes the notebook easy to review even when the DataFrames contain many columns.
Overall Workflow
The notebook follows a clear five-step workflow:
Import the required Python libraries and configure RapidAPI access.
Retrieve Multibagger Scan data from the Energy sector.
Retrieve Breakout Alerts data from the Indonesia Stock Exchange API.
Convert the API responses into pandas DataFrames.
Extract standardized record lists from different JSON response structures.
Print the top Multibagger candidates.
Print the top Breakout Alerts.
Generate a concise statistical summary.
Why This Project Matters
Multibagger Scan and Breakout Alerts provide two different ways to review potential market opportunities.
Multibagger Scan focuses on identifying candidates that meet selected scoring criteria, while Breakout Alerts highlight stocks showing breakout-related signals. By combining both datasets in one notebook, users can review longer-term growth candidates and shorter-term breakout signals in the same workflow.
The notebook is intentionally lightweight. It does not add prediction models, trading recommendations, or complex visualizations. Instead, it focuses on retrieving API data, converting the responses into structured tables, and summarizing the most relevant records.
This structure makes the project useful as a starting point for building more advanced screening dashboards, automated market reports, or stock monitoring tools using the Indonesia Stock Exchange API.
Conclusion
The Multibagger Scan and Breakout Alerts Dashboard demonstrates how Python can be used to retrieve, display, and summarize market screening data from the Indonesia Stock Exchange API.
Using requests and pandas, the notebook requests Multibagger Scan data from the Energy sector, retrieves Breakout Alerts, converts both API responses into DataFrames, and prints concise summaries of the strongest candidates and alerts.
Although simple, the project provides a clean foundation for anyone who wants to build a market screening workflow using Python and the Indonesia Stock Exchange API.