
Institutional trading activity and sector rotation are two important indicators frequently monitored by investors when evaluating overall market conditions. While Bandar Accumulation provides insight into accumulation activity on individual stocks, Sector Rotation highlights which industries are currently attracting market attention.
Instead of manually collecting this information from multiple sources, Python can automate the entire workflow by retrieving both datasets directly from the Indonesia Stock Exchange API. Once the responses are received, they can be transformed into structured tables, analyzed, and visualized for easier interpretation.
In this tutorial, we build a Bandar Accumulation and Sector Rotation Dashboard using Python and the Indonesia Stock Exchange API. The notebook retrieves Bandar Accumulation and Sector Rotation data, converts the returned JSON responses into pandas DataFrames, performs a simple market analysis, and visualizes the results using Matplotlib.
The notebook is organized into five sequential sections covering library imports, API requests, data parsing, market analysis, and visualization.
What This Project Builds
This notebook builds a lightweight dashboard for monitoring institutional accumulation activity and market sector rotation.
The completed workflow includes:
Bandar Accumulation retrieval
Sector Rotation retrieval
RapidAPI integration
Sample data fallback
JSON parsing
pandas DataFrame transformation
Market analysis
Matplotlib visualization
Rather than building a predictive trading model, the notebook focuses on retrieving, organizing, analyzing, and visualizing market information obtained directly from the Indonesia Stock Exchange API.
CELL 1 — Import Library
import requests
import pandas as pd
import matplotlib.pyplot as plt

# ===========================
# RapidAPI Configuration
# ===========================

API_KEY = "YOUR_API_KEY"

HEADERS = {
    "x-rapidapi-key": API_KEY,
    "x-rapidapi-host": "indonesia-stock-exchange-idx.p.rapidapi.com",
    "Content-Type": "application/json"
}

BASE_URL = "https://indonesia-stock-exchange-idx.p.rapidapi.com"
Note: Replace the original API key with
YOUR_API_KEYbefore publishing the notebook.
Explanation
The notebook begins by importing the Python libraries required throughout the project. The implementation uses only three libraries because the workflow focuses on retrieving market data, processing API responses, and generating simple visualizations.
The requests library is responsible for sending HTTP requests to the Indonesia Stock Exchange API. Every market dataset retrieved later in the notebook depends on this library for communication with the API endpoints.
After receiving the API responses, pandas transforms the returned JSON objects into structured DataFrames. This makes the retrieved market information easier to inspect, analyze, and display compared with working directly with nested JSON structures.
The notebook also imports matplotlib.pyplot, which is used in the final section to visualize both Sector Rotation scores and the Bandar Accumulation score.
The second part of the cell prepares the RapidAPI configuration. The notebook stores the authentication key inside the API_KEY variable, defines the HTTP request headers, and specifies the base URL for the Indonesia Stock Exchange API. These configuration variables are reused throughout the notebook so that every API request follows the same authentication settings.
CELL 2 — Request API
def get_json(endpoint):

    url = BASE_URL + endpoint

    print(f"\nEndpoint : {endpoint}")

    r = requests.get(url, headers=HEADERS)

    print("Status :", r.status_code)

    if r.status_code == 200:
        return r.json()

    elif r.status_code == 429:
        print("⚠️ Rate limit tercapai.")
        return None

    elif r.status_code == 403:
        print("⚠️ API belum subscribe.")
        return None

    else:
        print(r.text)
        return None


bandar_json = get_json(
    "/api/analysis/bandar/accumulation/BUMI?days=30"
)

sector_json = get_json(
    "/api/analysis/retail/sector-rotation"
)


# ===========================
# Sample Data jika API gagal
# ===========================

if bandar_json is None:

    bandar_json = {
        "success": True,
        "data": {
            "symbol":"BUMI",
            "company_name":"BUMI",
            "accumulation_score":74,
            "status":"ACCUMULATION",
            "foreign_buy":18000000000,
            "foreign_sell":7000000000,
            "net_foreign":11000000000,
            "confidence":91
        }
    }

    print("✅ Menggunakan sample Bandar Accumulation")


if sector_json is None:

    sector_json = {
        "success":True,
        "data":[
            {"sector":"Energy","score":88},
            {"sector":"Financial","score":80},
            {"sector":"Infrastructure","score":74},
            {"sector":"Healthcare","score":63},
            {"sector":"Technology","score":55},
            {"sector":"Consumer","score":49}
        ]
    }

    print("✅ Menggunakan sample Sector Rotation")
Explanation
The second section is responsible for retrieving market analysis data from the Indonesia Stock Exchange API.
The notebook begins by defining a reusable helper function named get_json(). Instead of writing nearly identical request logic for every API endpoint, the notebook centralizes the communication process into a single function. This improves readability while making future maintenance significantly easier.
Each API request starts by combining the predefined base URL with the endpoint supplied to the function. The notebook then sends an HTTP GET request using the authentication headers configured in the previous section.
During execution, the notebook prints both the requested endpoint and the returned HTTP status code. These messages allow users to verify whether the request has been completed successfully.
The helper function also includes simple error handling. If the API returns HTTP 429, the notebook reports that the request limit has been exceeded. If HTTP 403 is returned, the notebook informs the user that the API endpoint has not yet been subscribed to. In both situations, the function returns None, allowing the notebook to continue using fallback sample data instead of terminating execution.
After defining the helper function, the notebook retrieves two datasets. The first request obtains Bandar Accumulation information for the BUMI stock symbol during the last thirty days, while the second retrieves the current Sector Rotation dataset.
To improve reliability, the notebook prepares predefined sample data for both datasets. Whenever an API request fails because of subscription limitations or request limits, the notebook automatically substitutes realistic sample responses so that the remaining analysis and visualization steps can continue without
CELL 3 — Parsing Data
print("=== Bandar Accumulation ===")

bandar = bandar_json["data"]

display(pd.DataFrame([bandar]))


print("\n=== Sector Rotation ===")

sector_df = pd.DataFrame(sector_json["data"])

display(sector_df)
Explanation
After retrieving both API responses, the notebook transforms the returned JSON objects into pandas DataFrames so the information can be presented in a structured and readable format.
The first section focuses on Bandar Accumulation. Instead of working directly with the complete JSON response, the notebook extracts the data object, which contains the primary accumulation information returned by the API. This object is assigned to the bandar variable before being converted into a single-row pandas DataFrame.
Displaying the information as a DataFrame provides a cleaner representation of the returned fields, including the stock symbol, company name, accumulation score, status, foreign transaction values, net foreign value, and confidence score.
The notebook then processes the Sector Rotation response. Unlike Bandar Accumulation, this endpoint already returns a collection of sector records inside the data field. The notebook converts this list directly into a pandas DataFrame, producing a structured table containing every sector together with its corresponding rotation score.
By converting both API responses into DataFrames at this stage, the notebook prepares the datasets for the analysis performed in the following section while also allowing users to inspect the raw market information before any interpretation is made.
CELL 4 — Analysis
print("========== ANALISIS ==========\n")

print("Saham :", bandar.get("symbol", "-"))
print("Perusahaan :", bandar.get("company_name", "-"))
print("Status :", bandar.get("status", "-"))
print("Accumulation Score :", bandar.get("accumulation_score", "-"))
print("Confidence :", bandar.get("confidence", "-"), "%")

# Ambil net foreign hanya jika tersedia
net_foreign = bandar.get("net_foreign")

if net_foreign is not None:
    print("Net Foreign :", f"{net_foreign:,}")
else:
    print("Net Foreign : Data tidak tersedia dari API")

print("\nTop Sector Rotation")

top_sector = sector_df.sort_values(
    "score",
    ascending=False
).head(3)

display(top_sector)

print("\nInterpretasi Bandar Accumulation")

score = bandar.get("accumulation_score", 0)

if score >= 70:
    print("✅ Bandar sedang melakukan akumulasi kuat.")
elif score >= 50:
    print("⚠️ Akumulasi masih moderat.")
elif score > 0:
    print("ℹ️ Akumulasi lemah / netral.")
else:
    print("❌ Belum ada indikasi akumulasi.")

print("\nSektor yang sedang memimpin rotasi pasar:")

for _, row in top_sector.iterrows():
    print(f"- {row.get('sector', '-')} ({row.get('score', '-')})")
Explanation
Once the datasets have been parsed successfully, the notebook performs a simple market analysis using the retrieved information.
The analysis begins by displaying the key information returned by the Bandar Accumulation endpoint. Instead of accessing dictionary keys directly, the notebook uses the get() method to safely retrieve values such as the stock symbol, company name, accumulation status, accumulation score, and confidence level. This approach prevents runtime errors if a particular field is missing from the API response.
The notebook then checks whether the net foreign value is available. Because this field may not always be returned by the API, an additional validation step is performed before printing the value. When the field exists, it is displayed using formatted numeric output for improved readability. Otherwise, the notebook informs the user that the information is unavailable.
The second part of the analysis focuses on Sector Rotation. The notebook sorts the sector DataFrame by the rotation score in descending order and selects the three highest-scoring sectors. These sectors are displayed as the leading market sectors, providing a quick overview of which industries currently have the strongest rotation scores.
The notebook also provides a simple interpretation of the Bandar Accumulation score. Using conditional statements, the accumulation score is grouped into several categories. Scores of seventy or higher are interpreted as strong accumulation, moderate scores indicate ongoing accumulation, lower positive scores suggest weak or neutral accumulation, while a score of zero indicates that no accumulation signal is currently available.
Finally, the notebook prints the names and scores of the three highest-ranked sectors obtained from the Sector Rotation analysis. This concise summary combines stock-specific accumulation information with broader market sector performance, allowing users to review both datasets together before moving to the visualization stage.
CELL 5 — Visualization
plt.figure(figsize=(8,5))

plt.bar(
    sector_df["sector"],
    sector_df["score"]
)

plt.title("Sector Rotation Score")

plt.ylabel("Rotation Score")

plt.xticks(rotation=20)

plt.show()


plt.figure(figsize=(4,4))

plt.bar(
    ["Accumulation"],
    [bandar["accumulation_score"]]
)

plt.title("Bandar Accumulation Score")

plt.ylim(0,100)

plt.show()
Explanation
The final cell visualizes the two processed datasets using Matplotlib.
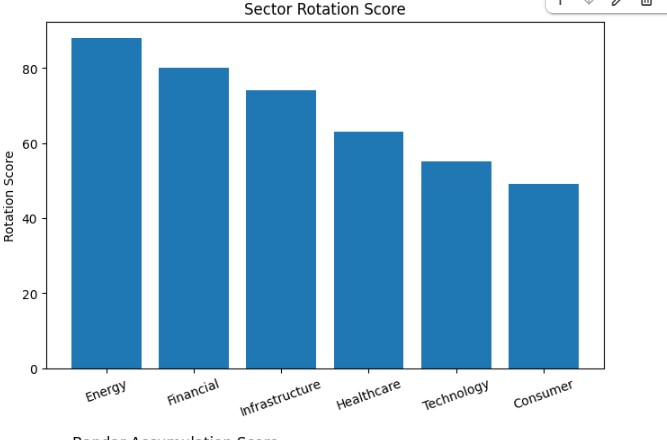
The first visualization focuses on Sector Rotation. The notebook creates a bar chart using the sector column as the category label and the score column as the bar value. This chart makes it easier to compare rotation scores across different market sectors without reading the table manually.
The chart title is set to Sector Rotation Score, and the y-axis is labeled Rotation Score. The x-axis labels are rotated slightly to improve readability, especially when sector names are longer or when multiple sectors are displayed.
After the Sector Rotation chart is displayed, the notebook creates a second visualization for Bandar Accumulation. This chart contains one bar labeled Accumulation, using the value from bandar["accumulation_score"].
The y-axis range is limited from 0 to 100, which matches the score-based interpretation used earlier in the analysis section. This makes the accumulation score easier to understand visually because users can immediately see whether the score is closer to weak, moderate, or strong accumulation territory.
Together, these two charts provide a simple visual summary of both market dimensions covered in the notebook: sector-level rotation and stock-specific accumulation.
Result
The notebook produces two main outputs: Bandar Accumulation and Sector Rotation.
Bandar Accumulation Output
The first output displays Bandar Accumulation data for the BUMI stock symbol.
The notebook extracts the data object from the API response and converts it into a pandas DataFrame. This table displays available accumulation-related fields such as symbol, company name, accumulation score, status, foreign buy value, foreign sell value, net foreign value, and confidence score when those fields are available.
The analysis section then prints the selected stock, company name, status, accumulation score, confidence level, and net foreign value if the API provides it. It also interprets the accumulation score using simple conditional logic.
Sector Rotation Output
The second output displays Sector Rotation data.
The notebook converts the sector response into a pandas DataFrame and sorts it by the score column. The three sectors with the highest scores are displayed as the current top sector rotation candidates.
The notebook also prints each leading sector together with its score, making the market rotation summary easier to read.
Visualization Output
The visualization section generates two charts.
The first chart shows Sector Rotation Score using a bar chart across all sectors. The second chart shows the Bandar Accumulation Score as a single-bar visualization with a range from 0 to 100.
These charts provide a simple visual layer on top of the tabular and text-based analysis.
Overall Workflow
The notebook follows a clear five-step workflow:
Import the required Python libraries and configure RapidAPI headers.
Request Bandar Accumulation and Sector Rotation data from the Indonesia Stock Exchange API.
Apply sample data when API requests fail due to rate limits or subscription restrictions.
Parse API responses into pandas DataFrames.
Analyze accumulation information and identify the top sector rotation scores.
Visualize Sector Rotation and Bandar Accumulation using Matplotlib.
Why This Project Matters
Bandar Accumulation and Sector Rotation provide two different perspectives on market activity.
Bandar Accumulation focuses on a specific stock and helps users review whether there is an accumulation signal based on the returned score. Sector Rotation looks at the broader market by showing which sectors currently have the strongest rotation scores.
By combining both datasets in one notebook, users can review stock-level activity and sector-level movement together. This makes the workflow useful for investors, analysts, and developers who want to build lightweight market monitoring tools using Python.
The project also includes fallback sample data, allowing the notebook to continue running even when the API request fails because of rate limits or subscription restrictions. This makes it easier to demonstrate, test, and explain the workflow without depending completely on live API availability.
Conclusion
The Bandar Accumulation and Sector Rotation Dashboard demonstrates how Python can be used to retrieve, parse, analyze, and visualize market information from the Indonesia Stock Exchange API.
Using requests, pandas, and Matplotlib, the notebook retrieves Bandar Accumulation data for BUMI, retrieves Sector Rotation information, converts both responses into DataFrames, performs a simple analysis, and visualizes the results using bar charts.
Although the project is lightweight, it provides a clear foundation for building more advanced market dashboards that combine stock-specific accumulation signals with broader sector rotation insights.