
Bandar Accumulation API analysis is becoming increasingly important in modern stock market intelligence systems.
In many IDX stock analysis workflows, traders and analysts need more than price movement data. They need deeper insight into institutional activity, accumulation behavior, and unusual trading patterns. By combining Bandar Accumulation API data with Pump Dump Detection analysis, traders can monitor smart money movement and detect speculative market activity more effectively.
This notebook demonstrates how to build a complete Bandar Accumulation API workflow using Python and Indonesia Stock Exchange market data.
The project retrieves Bandar Accumulation API and Pump Dump Detection data, normalizes JSON responses, cleans market datasets, generates market signals, and creates final market intelligence reporting using Python and Pandas.
CELL 1 — Import Libraries
import requests
import pandas as pd
from IPython.display import HTML, display

print("Libraries imported successfully.")
Explanation
Cell 1 prepares the notebook environment and imports the required libraries.
The notebook imports:
requestsfor API communicationpandasfor dataframe processingHTMLanddisplayfromIPython.displayfor dataframe visualization inside Jupyter Notebook
These libraries create the foundation for the market intelligence workflow.
At the end of the cell, the notebook prints a confirmation message showing that all libraries have been imported successfully.
CELL 2 — API Configuration & Fetch Data
RAPIDAPI_KEY = "YOUR_API_KEY"

headers = {
    "Content-Type": "application/json",
    "x-rapidapi-host": "indonesia-stock-exchange-idx.p.rapidapi.com",
    "x-rapidapi-key": RAPIDAPI_KEY
}

# API URLs
URL_PUMPDUMP = (
    "https://indonesia-stock-exchange-idx.p.rapidapi.com/"
    "api/analysis/bandar/pump-dump/BUMI?days=14"
)

URL_ACCUMULATION = (
    "https://indonesia-stock-exchange-idx.p.rapidapi.com/"
    "api/analysis/bandar/accumulation/BUMI?days=30"
)

# Fetch APIs
pumpdump_data = requests.get(
    URL_PUMPDUMP,
    headers=headers
).json()

accumulation_data = requests.get(
    URL_ACCUMULATION,
    headers=headers
).json()

print("API data fetched successfully.")
Explanation
Cell 2 handles API configuration and retrieves market intelligence data.
The notebook first defines the API authentication using:
RAPIDAPI_KEYContent-Typex-rapidapi-hostx-rapidapi-key
Then, the notebook defines two API endpoints:
URL_PUMPDUMPURL_ACCUMULATION
The getPumpDumpDetection API focuses on unusual market activity for the stock symbol BUMI over the last 14 days.
The getBandarAccumulation API focuses on accumulation activity for the same stock over the last 30 days.
The notebook sends API requests using requests.get() and immediately converts the responses into JSON format using .json().
At the end of the cell, the notebook prints a confirmation message indicating that both API datasets have been retrieved successfully.
This cell becomes the main data collection stage for the IDX market intelligence workflow.
CELL 3 — Normalize & Prepare Data
# ============================================================
# CELL 3 - NORMALIZE DATA (FIXED)
# ============================================================

# =========================
# PUMP DUMP DATA
# =========================

if "data" in pumpdump_data:

    df_pumpdump = pd.json_normalize(
        pumpdump_data["data"]
    )

else:

    df_pumpdump = pd.json_normalize(
        pumpdump_data
    )

# =========================
# ACCUMULATION DATA
# =========================

if "data" in accumulation_data:

    df_accumulation = pd.json_normalize(
        accumulation_data["data"]
    )

else:

    df_accumulation = pd.json_normalize(
        accumulation_data
    )

# Convert to string
df_pumpdump = df_pumpdump.astype(str)
df_accumulation = df_accumulation.astype(str)

print("=== Pump Dump Data ===")
display(df_pumpdump.head())

print("=== Accumulation Data ===")
display(df_accumulation.head())

print("\nPump Dump Columns:")
print(df_pumpdump.columns)

print("\nAccumulation Columns:")
print(df_accumulation.columns)
Explanation
Cell 3 normalizes and prepares the API data for analysis.
Financial APIs often return nested JSON structures that are difficult to analyze directly. The notebook handles this problem using pd.json_normalize().
The workflow first checks whether the API response contains a data field.
If the data field exists, the notebook normalizes that section directly. Otherwise, the entire payload is normalized.
This process creates two structured dataframes:
df_pumpdumpdf_accumulation
After normalization, the notebook converts all dataframe columns into string format using .astype(str).
This conversion helps avoid issues caused by:
Mixed data types
Nested objects
Inconsistent API responses
The notebook then:
Displays sample dataframe rows
Prints dataframe column names
This step helps analysts verify whether the API data has been processed correctly before continuing to market analysis.
CELL 4 — Generate Market Insight
# Simple insight extraction

pumpdump_rows = len(df_pumpdump)
accumulation_rows = len(df_accumulation)

if accumulation_rows > pumpdump_rows:
    market_signal = "Strong Accumulation Activity"
else:
    market_signal = "Potential Pump & Dump Activity"

print("Market Signal:", market_signal)
Explanation
Cell 4 generates a simple market insight based on dataset size comparison.
The notebook calculates:
Total rows in
df_pumpdumpTotal rows in
df_accumulation
The workflow then compares both totals.
If accumulation activity contains more records than pump and dump activity, the notebook generates the signal:
Strong Accumulation Activity
Otherwise, the notebook generates:
Potential Pump & Dump Activity
This logic creates a simple market intelligence interpretation based on trading behavior patterns.
Although the logic is simple, it demonstrates how API datasets can be transformed into automated market insight generation.
This approach can later be expanded into more advanced market surveillance systems.
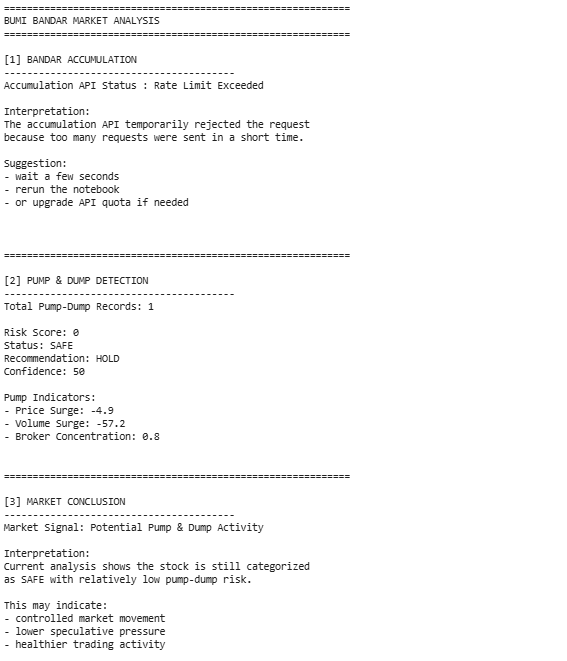
CELL 5 — Generate Final Market Analysis
# ============================================================
# CELL 5 - CLEAN FINAL MARKET ANALYSIS
# ============================================================

print("=" * 60)
print("BUMI BANDAR MARKET ANALYSIS")
print("=" * 60)

# ============================================================
# CHECK ACCUMULATION API
# ============================================================

accumulation_error = False

if "message" in df_accumulation.columns:

    accumulation_error = True

# ============================================================
# ACCUMULATION SECTION
# ============================================================

print("\n[1] BANDAR ACCUMULATION")
print("-" * 40)

if accumulation_error:

    print("Accumulation API Status : Rate Limit Exceeded")

    print("""
Interpretation:
The accumulation API temporarily rejected the request
because too many requests were sent in a short time.

Suggestion:
- wait a few seconds
- rerun the notebook
- or upgrade API quota if needed
""")
Explanation
Cell 5 creates the final market intelligence analysis report.
The notebook first prints a structured market analysis header titled:
BUMI BANDAR MARKET ANALYSIS
Then, the workflow checks whether the accumulation API response contains a message column.
If the column exists, the notebook assumes the API returned an error response, most likely caused by API rate limits.
The notebook then generates:
API status information
Error interpretation
User suggestions
The suggestions include:
Waiting a few seconds
Rerunning the notebook
Upgrading API quota if needed
This type of error handling is important in real-world financial API workflows because APIs frequently apply request limits.
The notebook demonstrates how market intelligence systems can remain informative even when API limitations occur.
Result:
OVERALL WORKFLOW
This notebook follows a structured IDX market intelligence workflow.
First, it imports the required Python libraries.
Second, it configures the RapidAPI authentication and API endpoints.
Third, it retrieves data from:
getPumpDumpDetectiongetBandarAccumulation
Fourth, it normalizes both API responses into structured dataframes.
Fifth, it converts dataframe values into consistent formats.
Sixth, it generates a simple market signal based on activity comparison.
Finally, it creates a final market intelligence analysis report with error handling and interpretation.
The final result is a lightweight market intelligence workflow capable of monitoring accumulation activity and unusual trading behavior.
WHY THIS CASE MATTERS
Many stock analysis projects focus only on price charts.
However, market intelligence analysis becomes more valuable when it also monitors accumulation activity and unusual trading behavior.
Bandar accumulation analysis helps identify possible institutional activity, while pump and dump detection helps identify speculative or abnormal market movement.
By combining both APIs into one workflow, this notebook creates a stronger foundation for stock market monitoring.
This workflow does not create trading signals directly. Instead, it creates a structured market intelligence layer that supports deeper analysis and decision-making.
CONCLUSION
This tutorial demonstrates how to build an IDX market intelligence workflow using Python, getBandarAccumulation, and getPumpDumpDetection.
The notebook retrieves API data, normalizes JSON responses, converts data into structured dataframes, generates market insights, and creates a final market analysis report.
The final workflow provides:
Structured accumulation analysis
Pump and dump activity monitoring
Automated market insight generation
API error handling
Market intelligence reporting
For traders, analysts, and fintech developers, this project can become a practical foundation for building stock surveillance systems, market anomaly monitoring tools, and advanced market intelligence platforms.
In the end, the project is not only about retrieving API data. It is about transforming raw market activity into meaningful insights that support smarter stock market analysis.