
INTRODUCTION
Corporate actions can change the way investors look at a stock.
One of the corporate actions that often attracts market attention is a right issue. When a company announces or schedules a right issue, traders and investors may start watching how the stock price reacts before or after the event. Price movement, trading volume, and daily return can become useful signals for understanding market behavior around that corporate action.
This notebook builds a simple case study: how to analyze stock price movement around right issue events using Python.
Instead of only downloading price data, the notebook combines two types of information. The first is OHLCV price data from getOHLCV, and the second is corporate action calendar data from getRightIssueCalendar.
By combining both datasets, the notebook creates a workflow that can help answer a practical question: does a selected stock have a right issue event, and how does its price and volume behave within the selected OHLCV period?
Cell 1 — Import Library
import os
import json
import time
from typing import Any, Dict, List, Optional, Union

import requests
import pandas as pd
import matplotlib.pyplot as plt
Explanation
Cell 1 imports all libraries needed for the project.
os is prepared for environment-related operations, especially if the API key is later stored in an environment variable. json is used to preview API responses in a readable JSON format. time is used to create a short delay between API requests.
The notebook also imports type hint utilities from typing, including Any, Dict, List, Optional, and Union. These are used in helper functions to make the code structure clearer.
requests is used to call the API endpoints. pandas is used to process the API response into dataframes. matplotlib.pyplot is used to visualize close price and trading volume.
This first cell prepares the technical foundation for the entire analysis.
Cell 2 — Konfigurasi API
RAPIDAPI_HOST = "indonesia-stock-exchange-idx.p.rapidapi.com"
BASE_URL = f"https://{RAPIDAPI_HOST}"

# Ganti dengan RapidAPI Key Anda
RAPIDAPI_KEY = "ISI_RAPIDAPI_KEY_ANDA_DI_SINI"

# Alternatif jika memakai environment variable:
# RAPIDAPI_KEY = os.getenv("RAPIDAPI_KEY")

if not RAPIDAPI_KEY or RAPIDAPI_KEY == "ISI_RAPIDAPI_KEY_ANDA_DI_SINI":
    raise ValueError("Masukkan RapidAPI Key Anda dulu pada variabel RAPIDAPI_KEY.")

HEADERS = {
    "Content-Type": "application/json",
    "x-rapidapi-host": RAPIDAPI_HOST,
    "x-rapidapi-key": RAPIDAPI_KEY,
}

print("API configuration ready.")
Explanation
Cell 2 configures the API connection.
RAPIDAPI_HOST stores the RapidAPI host for the Indonesia Stock Exchange IDX API. BASE_URL is created using that host and becomes the base URL for all endpoint calls.
The variable RAPIDAPI_KEY stores the RapidAPI key. In the original notebook, this section is where the user places their own API key. For a public tutorial, the key should be replaced with a placeholder to avoid exposing private credentials.
The notebook also provides an alternative method using environment variables:
# RAPIDAPI_KEY = os.getenv("RAPIDAPI_KEY")This is useful when the notebook is used in a safer production or shared environment.
The validation block checks whether the API key is empty or still using the placeholder. If the key has not been set properly, the notebook raises a ValueError.
Finally, the HEADERS dictionary is created. It contains the required request headers: Content-Type, x-rapidapi-host, and x-rapidapi-key.
When the setup is complete, the notebook prints:
API configuration ready.
Cell 3 — Helper Function
def request_get(
    endpoint: str,
    params: Optional[Dict[str, Any]] = None,
    timeout: int = 30
) -> Union[Dict[str, Any], List[Any]]:
    url = f"{BASE_URL}{endpoint}"

    time.sleep(0.2)

    response = requests.get(
        url,
        headers=HEADERS,
        params=params,
        timeout=timeout
    )

    try:
        payload = response.json()
    except Exception:
        payload = response.text

    if not response.ok:
        raise RuntimeError(
            f"Request gagal. Status: {response.status_code}\n"
            f"URL: {response.url}\n"
            f"Response: {payload}"
        )

    return payload


def find_first_list(obj: Any) -> List[Dict[str, Any]]:
    if isinstance(obj, list):
        return obj if all(isinstance(item, dict) for item in obj) else []

    if isinstance(obj, dict):
        priority_keys = [
            "data", "result", "results", "items", "rows",
            "content", "chart", "ohlcv", "calendar", "events"
        ]

        for key in priority_keys:
            if key in obj:
                found = find_first_list(obj[key])
                if found:
                    return found

        for value in obj.values():
            found = find_first_list(value)
            if found:
                return found

    return []


def json_to_dataframe(payload: Union[Dict[str, Any], List[Any]]) -> pd.DataFrame:
    records = find_first_list(payload)

    if records:
        return pd.json_normalize(records)

    if isinstance(payload, dict):
        return pd.json_normalize(payload)

    return pd.DataFrame()


def detect_column(df: pd.DataFrame, keywords: List[str]) -> Optional[str]:
    if df.empty:
        return None

    lower_map = {col.lower(): col for col in df.columns}

    for keyword in keywords:
        if keyword.lower() in lower_map:
            return lower_map[keyword.lower()]

    for col in df.columns:
        col_lower = col.lower()
        if any(keyword.lower() in col_lower for keyword in keywords):
            return col

    return None


def safe_series(df: pd.DataFrame, col: Optional[str], default_value=None) -> pd.Series:
    if col is None or col not in df.columns:
        return pd.Series([default_value] * len(df), index=df.index)

    return df[col]
Explanation
Cell 3 contains helper functions used throughout the notebook.
The first function, request_get, sends a GET request to an API endpoint. It combines BASE_URL with the endpoint path, waits for 0.2 seconds using time.sleep(0.2), then sends the request using requests.get.
After receiving the response, the function tries to parse it as JSON. If JSON parsing fails, the response is stored as text.
If the response status is not successful, the function raises a RuntimeError containing the status code, URL, and response payload. This makes debugging easier if the API request fails.
The second function, find_first_list, searches through a nested JSON object and tries to find the first list of dictionaries. This is useful because API responses can have different structures. The data might be stored under keys such as data, result, results, items, chart, ohlcv, calendar, or events.
The third function, json_to_dataframe, converts an API response into a dataframe. It first searches for a list of records using find_first_list. If records are found, it uses pd.json_normalize. If not, it normalizes the dictionary directly.
The fourth function, detect_column, detects column names based on a list of possible keywords. This is useful because API responses may use different column names for the same concept. For example, close price may appear as close, c, or price.
The final function, safe_series, safely returns a dataframe column. If the column does not exist, it returns a default series with the same length as the dataframe.
Together, these helper functions make the notebook more flexible when handling different API response formats.
Cell 4 — Ambil Data dari API getOHLCV dan getRightIssueCalendar
# Parameter OHLCV
SYMBOL = "BBCA"
TIMEFRAME = "daily"
FROM_DATE = "2026-02-10"
TO_DATE = "2026-02-18"
LIMIT = 0

# API getOHLCV
ohlcv_payload = request_get(
    endpoint=f"/api/chart/{SYMBOL}/{TIMEFRAME}",
    params={
        "limit": LIMIT,
        "from": FROM_DATE,
        "to": TO_DATE
    }
)

# API getRightIssueCalendar
right_issue_payload = request_get(
    endpoint="/api/calendar/right-issue"
)

ohlcv_df = json_to_dataframe(ohlcv_payload)
right_issue_df = json_to_dataframe(right_issue_payload)

ohlcv_df["source_api"] = "getOHLCV"
right_issue_df["source_api"] = "getRightIssueCalendar"

print("OHLCV shape:", ohlcv_df.shape)
print("Right Issue Calendar shape:", right_issue_df.shape)

display(ohlcv_df.head())
display(right_issue_df.head())

print("Preview OHLCV JSON:")
print(json.dumps(ohlcv_payload, indent=2, ensure_ascii=False)[:1500])

print("\nPreview Right Issue JSON:")
print(json.dumps(right_issue_payload, indent=2, ensure_ascii=False)[:1500])
Explanation
Cell 4 retrieves data from two APIs: getOHLCV and getRightIssueCalendar.
The notebook first defines the OHLCV parameters:
SYMBOL = "BBCA"
TIMEFRAME = "daily"
FROM_DATE = "2026-02-10"
TO_DATE = "2026-02-18"
LIMIT = 0
This means the notebook requests daily OHLCV data for BBCA from February 10, 2026 to February 18, 2026.
The getOHLCV API is called through this endpoint pattern:
/api/chart/{SYMBOL}/{TIMEFRAME}
The request also includes parameters for limit, from, and to.
Next, the notebook calls the getRightIssueCalendar API using:
/api/calendar/right-issue
This endpoint retrieves right issue calendar data.
Both API responses are converted into dataframes using json_to_dataframe.
The resulting dataframes are:
ohlcv_df
and
right_issue_df
The notebook then adds a source_api column to each dataframe. ohlcv_df receives getOHLCV, while right_issue_df receives getRightIssueCalendar.
After that, the notebook prints the shape of both dataframes, displays the first few rows, and prints a preview of the raw JSON responses.
This cell is the main data collection step. At this point, the notebook has collected both market price data and corporate action calendar data.
Cell 5 — Cleaning, Standarisasi, dan Gabungkan Data
# Deteksi kolom OHLCV
ohlcv_date_col = detect_column(
    ohlcv_df,
    ["date", "time", "timestamp", "datetime"]
)

open_col = detect_column(
    ohlcv_df,
    ["open", "o"]
)

high_col = detect_column(
    ohlcv_df,
    ["high", "h"]
)

low_col = detect_column(
    ohlcv_df,
    ["low", "l"]
)

close_col = detect_column(
    ohlcv_df,
    ["close", "c", "price"]
)

volume_col = detect_column(
    ohlcv_df,
    ["volume", "v", "vol"]
)


# Deteksi kolom Right Issue
ri_symbol_col = detect_column(
    right_issue_df,
    ["symbol", "ticker", "stockCode", "stock_code", "code", "securityCode"]
)

ri_company_col = detect_column(
    right_issue_df,
    ["company", "companyName", "company_name", "name", "issuer"]
)

ri_date_col = detect_column(
    right_issue_df,
    ["date", "cumDate", "cum_date", "recordingDate", "recording_date", "exDate", "ex_date"]
)

ri_ratio_col = detect_column(
    right_issue_df,
    ["ratio", "exerciseRatio", "exercise_ratio"]
)

ri_price_col = detect_column(
    right_issue_df,
    ["price", "exercisePrice", "exercise_price", "rightPrice", "right_price"]
)


print("Detected OHLCV columns:")
print("date  :", ohlcv_date_col)
print("open  :", open_col)
print("high  :", high_col)
print("low   :", low_col)
print("close :", close_col)
print("volume:", volume_col)

print("\nDetected Right Issue columns:")
print("symbol :", ri_symbol_col)
print("company:", ri_company_col)
print("date   :", ri_date_col)
print("ratio  :", ri_ratio_col)
print("price  :", ri_price_col)


# Cleaning OHLCV
ohlcv_clean = pd.DataFrame({
    "symbol": SYMBOL.upper(),
    "date": pd.to_datetime(safe_series(ohlcv_df, ohlcv_date_col, None), errors="coerce"),
    "open": pd.to_numeric(safe_series(ohlcv_df, open_col, None), errors="coerce"),
    "high": pd.to_numeric(safe_series(ohlcv_df, high_col, None), errors="coerce"),
    "low": pd.to_numeric(safe_series(ohlcv_df, low_col, None), errors="coerce"),
    "close": pd.to_numeric(safe_series(ohlcv_df, close_col, None), errors="coerce"),
    "volume": pd.to_numeric(safe_series(ohlcv_df, volume_col, None), errors="coerce"),
})

ohlcv_clean = ohlcv_clean.dropna(subset=["date"]).copy()
ohlcv_clean = ohlcv_clean.sort_values("date")


# Cleaning Right Issue
right_issue_clean = pd.DataFrame({
    "symbol": (
        safe_series(right_issue_df, ri_symbol_col, "")
        .astype(str)
        .str.upper()
        .str.strip()
    ),
    "company_name": safe_series(right_issue_df, ri_company_col, ""),
    "right_issue_date": pd.to_datetime(
        safe_series(right_issue_df, ri_date_col, None),
        errors="coerce"
    ),
    "ratio": safe_series(right_issue_df, ri_ratio_col, ""),
    "exercise_price": pd.to_numeric(
        safe_series(right_issue_df, ri_price_col, None),
        errors="coerce"
    ),
})

right_issue_clean = right_issue_clean[right_issue_clean["symbol"].ne("")].copy()


# Filter right issue untuk symbol OHLCV
right_issue_symbol = right_issue_clean[
    right_issue_clean["symbol"].eq(SYMBOL.upper())
].copy()


# Summary right issue untuk symbol
has_right_issue = not right_issue_symbol.empty

if has_right_issue:
    nearest_right_issue_date = right_issue_symbol["right_issue_date"].dropna().min()
else:
    nearest_right_issue_date = pd.NaT


# Gabungkan data OHLCV dengan informasi right issue
project_output = ohlcv_clean.copy()
project_output["has_right_issue_event"] = has_right_issue
project_output["nearest_right_issue_date"] = nearest_right_issue_date

if has_right_issue:
    project_output["days_to_right_issue"] = (
        project_output["nearest_right_issue_date"] - project_output["date"]
    ).dt.days
else:
    project_output["days_to_right_issue"] = None


# Hitung metrik harga
project_output["daily_return_pct"] = project_output["close"].pct_change() * 100
project_output["price_range"] = project_output["high"] - project_output["low"]
project_output["price_range_pct"] = (project_output["price_range"] / project_output["close"]) * 100
project_output["volume_change_pct"] = project_output["volume"].pct_change() * 100


display(ohlcv_clean.head())
display(right_issue_clean.head())
display(right_issue_symbol)
display(project_output)
Explanation
Cell 5 cleans, standardizes, and combines the OHLCV and right issue datasets.
The first part detects important OHLCV columns. The notebook searches for date, open, high, low, close, and volume columns using detect_column.
For example, the date column may appear as date, time, timestamp, or datetime. The close price column may appear as close, c, or price.
The second part detects important columns from the right issue calendar data. It searches for symbol, company name, event date, ratio, and exercise price columns.
After detecting the columns, the notebook prints the detected column names so the user can verify whether the correct fields were found.
Next, the notebook creates ohlcv_clean. This dataframe standardizes the OHLCV data into:
symbol
date
open
high
low
close
volume
The symbol is taken from the selected SYMBOL variable and converted to uppercase. The date column is converted using pd.to_datetime, while price and volume columns are converted using pd.to_numeric.
Rows without valid dates are removed, and the data is sorted by date.
Then, the notebook creates right_issue_clean. This dataframe standardizes the right issue calendar data into:
symbol
company_name
right_issue_date
ratio
exercise_price
The right issue symbol is converted into uppercase and cleaned from extra spaces. The date is converted into datetime format, and the exercise price is converted into numeric format.
After that, the notebook filters right issue data only for the selected OHLCV symbol. Since SYMBOL is set to BBCA, the notebook creates right_issue_symbol containing only right issue records for BBCA.
The notebook then checks whether the selected symbol has a right issue event using:
has_right_issue
If a right issue exists, the nearest right issue date is taken from right_issue_symbol. If not, the value becomes pd.NaT.
Next, the notebook combines the OHLCV data with right issue information by creating project_output.
The dataframe receives:
has_right_issue_event
nearest_right_issue_date
days_to_right_issue
If a right issue event exists, days_to_right_issue calculates the number of days between each OHLCV date and the nearest right issue date. If not, the column is filled with None.
Finally, the notebook calculates several price and volume metrics:
daily_return_pct
price_range
price_range_pct
volume_change_pct
These metrics help analyze price movement and trading activity around the possible right issue event.
At the end of the cell, the notebook displays the cleaned OHLCV data, cleaned right issue calendar data, right issue data for the selected symbol, and the final project output.
Cell 6 — Ringkasan Analisis, Visualisasi, dan Export
summary_df = pd.DataFrame({
    "metric": [
        "symbol",
        "from_date",
        "to_date",
        "total_ohlcv_rows",
        "total_right_issue_calendar_rows",
        "has_right_issue_event_for_symbol",
        "nearest_right_issue_date",
        "first_close",
        "last_close",
        "total_return_pct",
        "average_daily_return_pct",
        "average_volume"
    ],
    "value": [
        SYMBOL.upper(),
        FROM_DATE,
        TO_DATE,
        len(ohlcv_clean),
        len(right_issue_clean),
        has_right_issue,
        nearest_right_issue_date,
        ohlcv_clean["close"].iloc[0] if len(ohlcv_clean) > 0 else None,
        ohlcv_clean["close"].iloc[-1] if len(ohlcv_clean) > 0 else None,
        (
            ((ohlcv_clean["close"].iloc[-1] / ohlcv_clean["close"].iloc[0]) - 1) * 100
            if len(ohlcv_clean) > 1 else None
        ),
        project_output["daily_return_pct"].mean(),
        project_output["volume"].mean()
    ]
})

display(summary_df)


# Visualisasi harga close
plt.figure(figsize=(10, 5))
plt.plot(project_output["date"], project_output["close"], marker="o")
plt.xlabel("Date")
plt.ylabel("Close Price")
plt.title(f"{SYMBOL.upper()} Close Price with Right Issue Context")
plt.xticks(rotation=45)
plt.tight_layout()
plt.show()


# Visualisasi volume
plt.figure(figsize=(10, 5))
plt.bar(project_output["date"], project_output["volume"])
plt.xlabel("Date")
plt.ylabel("Volume")
plt.title(f"{SYMBOL.upper()} Trading Volume")
plt.xticks(rotation=45)
plt.tight_layout()
plt.show()


# Export CSV
ohlcv_clean.to_csv("ohlcv_clean.csv", index=False)
right_issue_clean.to_csv("right_issue_calendar_clean.csv", index=False)
project_output.to_csv("ohlcv_right_issue_analysis.csv", index=False)
summary_df.to_csv("ohlcv_right_issue_summary.csv", index=False)


# Export Excel
with pd.ExcelWriter("ohlcv_right_issue_project.xlsx", engine="openpyxl") as writer:
    ohlcv_df.to_excel(writer, sheet_name="ohlcv_raw", index=False)
    right_issue_df.to_excel(writer, sheet_name="right_issue_raw", index=False)
    ohlcv_clean.to_excel(writer, sheet_name="ohlcv_clean", index=False)
    right_issue_clean.to_excel(writer, sheet_name="right_issue_clean", index=False)
    right_issue_symbol.to_excel(writer, sheet_name="right_issue_symbol", index=False)
    project_output.to_excel(writer, sheet_name="final_analysis", index=False)
    summary_df.to_excel(writer, sheet_name="summary", index=False)

print("Export selesai:")
print("- ohlcv_clean.csv")
print("- right_issue_calendar_clean.csv")
print("- ohlcv_right_issue_analysis.csv")
print("- ohlcv_right_issue_summary.csv")
print("- ohlcv_right_issue_project.xlsx")
Explanation
Cell 6 creates the final summary, visualizations, and export files.
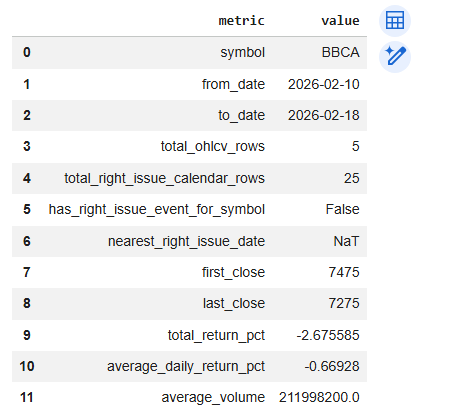
The first part creates summary_df. This dataframe stores key analysis metrics, including:
symbol
from_date
to_date
total_ohlcv_rows
total_right_issue_calendar_rows
has_right_issue_event_for_symbol
nearest_right_issue_date
first_close
last_close
total_return_pct
average_daily_return_pct
average_volume
This summary gives a quick overview of the selected stock, the OHLCV period, the number of rows, right issue status, price return, and average volume.
Next, the notebook creates two visualizations.
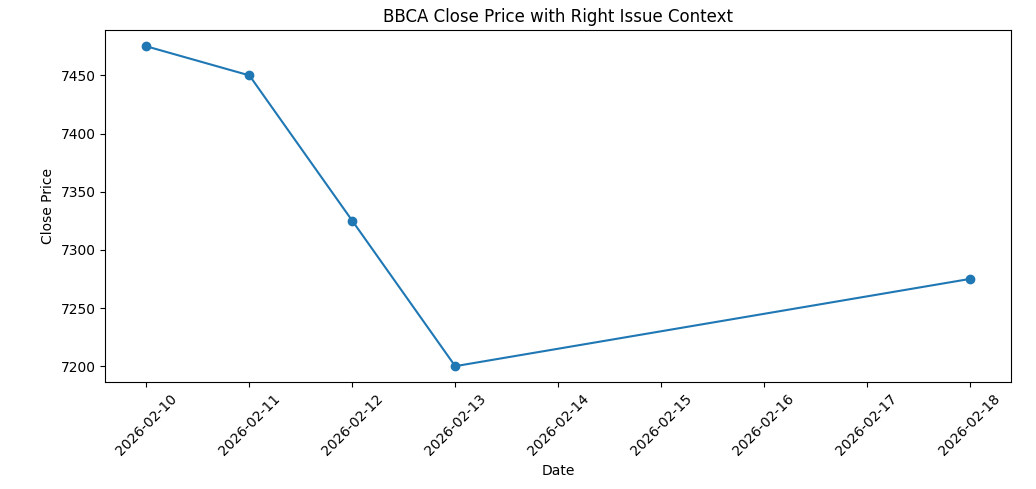
The first chart shows the close price movement over time using a line chart. The title includes the selected symbol and right issue context.
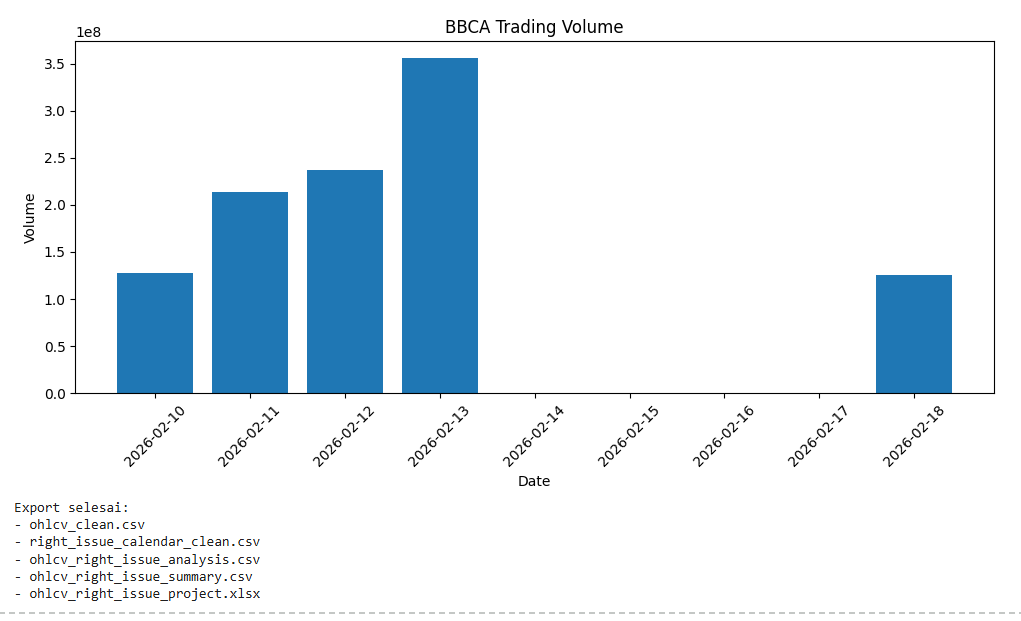
The second chart shows trading volume using a bar chart.
These visualizations help users see both price movement and trading activity during the selected period.
After visualization, the notebook exports several CSV files:
ohlcv_clean.csv
right_issue_calendar_clean.csv
ohlcv_right_issue_analysis.csv
ohlcv_right_issue_summary.csv
Then, the notebook creates an Excel file:
ohlcv_right_issue_project.xlsx
The Excel file contains multiple sheets:
ohlcv_raw
right_issue_raw
ohlcv_clean
right_issue_clean
right_issue_symbol
final_analysis
summary
This makes the analysis easier to review later in Excel or share as a structured report.
Finally, the notebook prints all exported filenames.
Result:
Overall Workflow
This notebook follows a clear and practical workflow.
First, it imports the required libraries.
Second, it configures the RapidAPI connection.
Third, it creates helper functions to request data, parse JSON, convert responses into dataframes, detect columns, and safely handle missing columns.
Fourth, it retrieves OHLCV data for BBCA using getOHLCV and retrieves right issue calendar data using getRightIssueCalendar.
Fifth, it cleans and standardizes both datasets.
Sixth, it checks whether the selected symbol has a right issue event.
Seventh, it combines OHLCV data with right issue context.
Eighth, it calculates daily return, price range, price range percentage, and volume change percentage.
Finally, it creates summaries, visualizations, and exports the results into CSV and Excel files.
Why This Case Matters
Many stock analysis projects focus only on price charts. But in real market analysis, price movement becomes more meaningful when combined with event context.
A right issue is one of the corporate actions that can influence investor attention, liquidity, and price behavior. By combining OHLCV data with right issue calendar data, this notebook helps users move from simple price tracking to event-aware stock analysis.
The case is practical because it connects market data and corporate action data in one workflow. This makes the analysis more useful for traders, investors, analysts, or data enthusiasts who want to understand how a stock behaves around important market events.
Conclusion
This tutorial shows how to analyze stock price movement around right issue events using Python, getOHLCV, and getRightIssueCalendar.
The notebook starts by preparing API configuration and helper functions. It then retrieves OHLCV data for a selected stock and right issue calendar data from the IDX API. After that, it cleans both datasets, checks whether the selected stock has a right issue event, combines the data, and calculates price and volume metrics.
The final output includes a summary table, close price visualization, volume visualization, CSV files, and a multi-sheet Excel report.
This workflow is useful because it does more than show historical price data. It adds corporate action context, allowing users to understand price movement with a clearer market event perspective.
For investors, traders, and data analysts, this approach can become a foundation for building a more advanced event-driven stock analysis system.